


Previously, this provincial took a look at the relationship between scholastic performance and student body racial composition for the two most populous counties on the Kansas side of the KCMO metro area. Let's do the same but this time at the national level, replacing individual schools with states and using data from the National Assessment of Educational Progress (NAEP).
The y-axis shows the percentages of each state's public school student bodies that are either non-Hispanic white or Asian (Ice students). The x-axis shows the amalgamated math and reading section scores from the 8th grade NAEP, administered in 2011:

The correlation between Ice student body percentage and combined math and reading scores is a positive .64 (p = .0000003). That's a pretty strong relationship for the social sciences, though it is not as nearly perfectly rigorous as the two-county correlation of .93 is. That's hardly surprising--the differences between the white population of Massachusetts and the white population of West Virginia are more numerous and more substantial than are the differences between the white populations of Olathe and Overland Park.
The farther below the green linear trend line a state falls, the 'better' it is performing relative to what the racial composition of its student body alone would predict. Conversely, the higher above the trend line a state floats, the 'worse' it is doing relative to what race alone would predict. West Virginia, predictably, looks awful. Evidence of the "Texas miracle" is manifest as well. Older Okie license plates hearken back to a time when average was, well, average, rather than an affront to a thing's dignity and self esteem. They read: Oklahoma is Ok. Indeed it is. Broadly speaking, the South puts on sub-par performances while the mid-Atlantic looks pretty good. Not a shocker to people who've read Albion's Seed. Perhaps less predictably, however, is the fact that with the exception of the sterling state of Massachusetts, New England is rather underwhelming.
Racial classification--being the broad, fuzzy concept that it is--isn't definitive, of course. Other disparate considerations like population density, culture, socioeconomic status, geography, ethnicity--hell, maybe even teaching tactics and classroom size--influence testing results. If race was everything, the correlation would be a perfect 1.0. That said, race is definitely predictive, and consequently it matters quite a bit.
Tangentially, interpreting the entrails of this graph, allow me to audaciously play augur and predict that within a generation, Texas, Arizona, Florida, Georgia, Louisiana, and, most boldly, Mississippi, will all be irretrievably lost to the GOP and will have become reliably blue states--final nails in the coffin of a moribund Republican party, unless it is somehow able to win over upper Midwest states like Minnesota, Iowa, Wisconsin, Michigan, Ohio, and Pennsylvania as compensation in the interim. I'm not putting my money on it.
The y-axis shows the percentages of each state's public school student bodies that are either non-Hispanic white or Asian (Ice students). The x-axis shows the amalgamated math and reading section scores from the 8th grade NAEP, administered in 2011:

The correlation between Ice student body percentage and combined math and reading scores is a positive .64 (p = .0000003). That's a pretty strong relationship for the social sciences, though it is not as nearly perfectly rigorous as the two-county correlation of .93 is. That's hardly surprising--the differences between the white population of Massachusetts and the white population of West Virginia are more numerous and more substantial than are the differences between the white populations of Olathe and Overland Park.
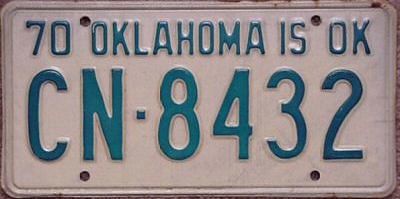
The farther below the green linear trend line a state falls, the 'better' it is performing relative to what the racial composition of its student body alone would predict. Conversely, the higher above the trend line a state floats, the 'worse' it is doing relative to what race alone would predict. West Virginia, predictably, looks awful. Evidence of the "Texas miracle" is manifest as well. Older Okie license plates hearken back to a time when average was, well, average, rather than an affront to a thing's dignity and self esteem. They read: Oklahoma is Ok. Indeed it is. Broadly speaking, the South puts on sub-par performances while the mid-Atlantic looks pretty good. Not a shocker to people who've read Albion's Seed. Perhaps less predictably, however, is the fact that with the exception of the sterling state of Massachusetts, New England is rather underwhelming.
Racial classification--being the broad, fuzzy concept that it is--isn't definitive, of course. Other disparate considerations like population density, culture, socioeconomic status, geography, ethnicity--hell, maybe even teaching tactics and classroom size--influence testing results. If race was everything, the correlation would be a perfect 1.0. That said, race is definitely predictive, and consequently it matters quite a bit.
Tangentially, interpreting the entrails of this graph, allow me to audaciously play augur and predict that within a generation, Texas, Arizona, Florida, Georgia, Louisiana, and, most boldly, Mississippi, will all be irretrievably lost to the GOP and will have become reliably blue states--final nails in the coffin of a moribund Republican party, unless it is somehow able to win over upper Midwest states like Minnesota, Iowa, Wisconsin, Michigan, Ohio, and Pennsylvania as compensation in the interim. I'm not putting my money on it.


0 comments:
Post a Comment