RSS
Facebook
Twitter

Showing posts with label Race. Show all posts

Sunday, December 22, 2013

The GSS is a gift that keeps on giving. I was unaware of a series of questions the survey put to respondents in 1990 and again in 2000 about the perceived proneness to violence among members of different racial groups. Inexcusable on my part, really, as that sort of thing is this blog's bread and butter. Better late than never, though. For contemporary relevance and because of the finer racial distinctions among participants that are possible in the data from 2000-onward than from before the turn of the millennium, the following comes from the later results.

Despite the Cathedral's intentional obfuscation of disparities in violence and criminality--and, when it's adherents think they can get away with it, blatant inversion of reality--people still tend to believe their own lying eyes rather than their mendacious overlords. The following graph shows the perceived proneness to violence by members of the four conventionally major 'racial' groupings in the US. The higher the score, the more violent the group is perceived to be*:


Blacks are perceived as the most violent, followed by Hispanics, then whites, and finally Asians. Irrational racism or racial realism? The data overwhelmingly support the latter, of course.

Although in a few short decades it will cease to be the case, non-Hispanic whites still form a majority in the US. Surely it is the oppressive majority's anti-NAM and pro-yellow biases that are skewing overall perceptions of racial differences in propensities for violence! Well, let's take a look.

Bear with me, the following graph is a bit difficult to comprehend at first blush. The racial categories along the x-axis (the horizontal line along the bottom) depict groups of survey respondents while the colored bars that run parallel to the y-axis (vertical line) illustrate how each category of survey respondents perceive each racial group's tendencies towards violence. So the first cluster shows how whites view each of the four groups, the second cluster shows how blacks view each of the groups, etc:


It's not only whites who correctly perceive the associations between race and violence. Hispanics and Asians do as well. Blacks present the only stark contrast with reality, perceiving whites and blacks to be (essentially) equally violent, with Hispanics and Asians less so. Grievance peddling race hustlers and their allies in the Media are relentless in their attempts to recast reality in such a way that it actually becomes blacks who need to be weary of whites rather than the other way around, and their efforts appear to be most successful among blacks, many of whom are more than happy to blame whitey for their problems.

What about SWPLs? Don't they see blacks with rose-colored tints and whites, uh, a little more darkly? Than conservative whites, yes, but reality even shakes this more pious contingent's faith in the Narrative. The following graph compares and contrasts the perceptions of liberal and conservative whites:


Less racial variance detected by leftists than by conservatives, but the general pattern is accurate perceived by both. While some credit is due, there is (faux^) ethnomasochism evident among white leftists worth remarking upon as well. Compared to their conservative co-racialists, liberal whites see blacks, Hispanics, and Asians as relatively pacific. When it comes to whites, however, liberals shelve some of their belief in the goodness of mankind and judge whites more harshly than conservatives do. Conservative whites, on the other hand, should come in for a bit of criticism for perhaps being too forgiving when it comes to whites vis-a-vis Asians.

Honest whites--even SWPLs--are having conversations with their children that are similar to the one prescribed by the Derb that subsequently led to his termination from the Cathedral's journalistic equivalent of the Washington Generals.

GSS variables used: YEAR(2000), POLVIEWS(1-2)(5-6), RACECEN1(1)(2)(4-10)(15-16), VIOLWHTS, VIOLBLKS, VIOLHSPS, VIOLASNS

** To facilitate viewing, I've inverted the GSS' scale, for which higher numbers illustrate less proneness to violence.

^ The qualifier here serving as a note that SWPLs are probably mostly thinking of the wrong kind of whites rather than of themselves when passing judgment on the violent tendencies of whites in general. They voted for Barack Obama and all that.

Tuesday, December 17, 2013

The knockout game phenomenon really, really makes the Establishment uncomfortable. Although it took several years, the seemingly senseless savagery it displayed finally forced the knockout game from being a subject covered almost exclusively by the alternative right to something the mainstream media found increasingly difficult to ignore. Sure, Fox News still does ten minute segments on it without once mentioning race, but at least they're raising awareness. That counts for something!

Four major reasons why the knockout game causes Establishment pontiffs such anxiety:

1) It validates the Derb's non-black version of "The Talk". Be weary around blacks who are unknown to you, especially when they outnumber your group, especially especially if you're a female or a man aged 40+, and especially especially especially if you're alone.

2) It makes a mockery of the mendacious hate crime Narrative the Establishment perpetually pushes. It's as familiar as it is diametrically opposed to reality--the Trayvon Martin/George Zimmerman saga being the most recent highly visible illustration, but it's pervasive presence can be detected in virtually every case in which putative irrational -isms are involved.

Instead, the knockout game displays the reality of interracial crime--it is an overwhelmingly black-on-white affair, with blacks nearly 40 times more likely to commit violent crimes against whites than viceversa. Blacks are even significantly more likely to be convicted of federally designated hate crimes than whites are (and that "white" number includes relatively more criminally prone Hispanics).

3) Relatedly, the knockout game reveals that one of the left's favorite tropes--that crime is an unfortunate but essentially unavoidable consequence of poverty--is bullshit. Correlation isn't causation, heh. The game's perpetrators aren't acting out of desperation, they're not stealing anything, and they're not enjoying any material gain from their vicious assaults--instead, they're acting out of a mix of boredom (poor people have a lot of free time on their hands), social posturing, racial animosity, and animalistic impulsivity.

4) It is about the most effective argument in favor of gun rights imaginable. The police can't protect potential victims from knockouts and contemporary American communities won't organically protect their fellow citizens, either. Only you can prevent knockouts, and the surest way of preventing them (or second surest--see item #1) is by packing heat.

Saturday, December 7, 2013

White flight from the white robe?

Taking note of Alfred Clark's observations about the 'ghettoization' of Christianity, the Derb recently wrote a piece for VDare exploring the phenomenon of white flight from the religion, an abandonment distinct from the general trend towards secularization in that it appears to be occurring more rapidly among whites than among NAMs.

The GSS has data on religious self-identification extending back through the early seventies up to the present. The following graph traces, by year, the percentages of non-Hispanic whites, non-Hispanic blacks, and Hispanics who indicated they had no religious affiliation. The mean sample sizes by year are 1112, 126, and 108, respectively:

Understanding there is some noise present in the year-to-year sampling, the white irreligious rate has been higher than the NAM irreligious rate has been over at least the last several decades. While the ratio hasn't changed much over the time period in question, the fact that the irreligious proportion of the population has gone from being fringe at the margins to the sizable minority that it is today probably makes the racial disparity more recognizable now than it was then. In the seventies, someone with no religious affiliation was so rare--and the proselytizing shrillness of New Atheism not yet a thing among them--that most people's pattern recognition software didn't pick up on the racial characteristics of non-believers. Today nearly one-in-five whites professes no affiliation, so if a person knows a handful of white guys, there's a good chance he knows at least one atheist or agnostic. And among an average person's facebook social circle there are tens or hundreds of people without any religious affiliation.

GSS variables used: RELIG(4), YEAR, ETHNIC(1)(2-3,6-15,18-19,21,23-27,32-33,36)(17,22,38)

Monday, November 25, 2013

Standing as one

A friendly gadfly notes the seemingly out-of-character failure to break down the results on preferred methods of raising a family by race. It wasn't included for a few reasons; as someone with an inclination towards citizenism, there are times when capturing the entire American flavor sounds more appetizing than unnecessarily compartmentalizing the palates (although that's admittedly an approach that doesn't tell the whole story--further drilling down is usually required); racial differences are fairly marginal; and sample sizes for non-whites aren't as large we would ideally like them to be.

But the data are there, so why cover them up? Decide for yourself if there is anything additional that needs saying. The following table shows the percentages of respondents, by race (N in parentheses) in 2012, who identified each of the following six scenarios as the most ideal:

ArrangementWhites (712) Blacks (151)Hispanics (73)Asians (46)
Mother home, father full-time40.6%34.7%45.4%34.4%
Mother part-time, father full-time41.1%43.2%36.3%53.6%
Both full-time11.3%17.3%2.3%7.5%
Both part-time6.3%4.7%14.9%4.5%
Mother full-time, father part-time0.2%0.0%0.0%0.0%
Mother full-time, father home0.6%0.0%1.1%0.0%

Even among a segment of the population for which over two-thirds of babies are born out of wedlock, the acknowledged ideal is one in which dad brings home the bacon and mom cooks it up.

It is often errantly argued that Hispanics are "natural conservatives", though these results make them appear quite progressive indeed--nearly 15% of those surveyed seem to have acclimated themselves to a Peak Jobs future in which part-time employment becomes more and more the norm not merely among the elderly and those in school, but among those in their prime working years as well.

GSS variables used: RACECEN1(1)(2)(4-10)(15-16), FAMWKBST(1-6)

Saturday, November 9, 2013

Virginia tells

As one of the most demographically representative states in the country, and one with an enormous amount of American history packed into it to boot, the gubernatorial results out of Virginia this week are worth examining as a way of better understanding America's contemporary social landscape.

- Cuccinelli, the Republican, won among whites by a margin (56%-36%) nearly identical to the margin Romney did in the 2012 presidential election (59%-39%). McAullife, the Democrat, similarly won among blacks (90%-8% compared to Obama's 93%-6%). No surprises here. At 72% of the Virginia electorate and shrinking, it is difficult for Republicans to win nationally representative elections without winning 2-to-1 among whites. The exit polling data do not report results for other groups due to insufficient sample size, but it's safe to assume McAullife won among the Hispanic/Asian/other residual about as convincingly as Obama did last year.

- Despite all the political polarization etc etc, the third party pipe dream is becoming less and less tenable as the US becomes less and less non-Hispanic white. Whites are the only people with whom Kang's famous taunt to (or was it Kodos'?) "go ahead, throw your vote away", actually resonates. Sarvis, the libertarian, got over 87% of his votes from whites. Cuccinelli received a strikingly similar share of his total votes from whites, coming in at just under 89%. McAullife, in contrast, received just over half of his votes (54%) from whites. Perhaps the seemingly disparate Democratic coalition breaks apart at some point in the future, but currently whites are the only ones who appear to have any willingness to oppose it.

- Why I think Rand Paul's liberty message has legs to stand on in the future: Sarvis' won nearly 15% of voters under age 30 but less than 6% of those aged 30 and over. Whether or not this is constitutes the making of a deal with the devil, reasonable people will disagree.

- The fat-cats-versus-working-class-union-types dichotomy became antiquated decades ago, not least because of the spending advantage Democrats now regularly enjoy, this election clearly being no exception. The new paradigm pits the top and the bottom in alliance against the middle:


Though he lost the race, Cuccinelli won comfortably among voters in households with annual incomes in the $50k-$100k range, and held his own in the $30k-$50k and $100k-$200k ranges, but was blown out by McAullife both among those earning less than $30k and among those making $200k+.

- Another way to characterize today's political dynamic is to pit the government trough eaters and trough fillers against the government food trough producers, or value transferers vs. value creators. Without the state's DC suburbs, from which almost 1-in-5 voters hailed from, Cuccinelli would've won by nearly the same margin he ended up losing by.

- While arguing that there should be some sort of property ownership requirement as a prerequisite to voting eligibility will figuratively lead to one being tarred-and-feathered to shouts of "no to Jim Crow!", the exit polls offer a more modest tact to take in opposition to universal suffrage, of a less personal nature than that preferred by Howard Stern, but similarly based.

Queried on whether Cuccinelli's positions--fairly described as strongly socially conservative within the parameters of contemporary American politics--were too liberal, too conservative, or just right, 8% of exit poll respondents answered "too liberal". Among this group comprising 8% of the electorate, 77% voted for McAullife! The actions of the 13% who said he was too liberal but still voted for him and to a lesser extent the 9% who said the same while voting for Sarvis are comprehensible, but the only conclusion regarding the vast majority who voted for McAuliffe because Cuccinelli is too liberal is that they simply have no idea what "liberal" or "conservative" means in a political context! These are people who would garner a goose egg (okay, it's multiple choice, but you get the idea) on Pew's Political News IQ test, unable to name the vice president or say which party controls the Senate.

Let's not be too critical of this contingent of utterly clueless voters, though. Chances are, they are quite a vibrantly diverse and diversely vibrant crowd and consequently worthy of reverence (even if--or perhaps especially because!--they come almost exclusively from the bottom part of that top-and-bottom alliance we spoke of earlier).

The reverse probably occurred as well, as there were inevitably a few Cuccinelli voters who said McAullife was "too conservative", but their numbers were too small to be statistically reliable and thus were not reported on.

Monday, October 14, 2013

Pat on the butt too much for Pats' fans

As a complement to Jayman's recent post on state laws regarding corporal punishment, I'll note that blacks express the greatest support for the practice as a means of disciplining children. Additional positive correlates include being male, politically conservative, and of modest intelligence. The GSS item doesn't specify who the spanker is, though it's reasonable to assume that much of the time the respondent has a parent in mind--if the question specifically inquired about opinions on schools using corporal punishment, the approval rates would surely be lower across the board.

One of Jayman's recurring themes is to employ an American Nations paradigm when evaluating social phenomena. The GSS doesn't allow quite that level of granularity, but it does break survey participants up by census region. The percentages of respondents who either "agree" or "strongly agree" with the statement "It is sometimes necessary to discipline a child with a good, hard spanking". For contemporary relevance, all responses are from 2000 onward. Here is a map of said regions for those who are unfamiliar with them:

Region%Spank
1) East South Central85.9
2) South Atlantic80.0
3) West South Central78.5
4) East North Central72.9
5) Mountain71.8
6) West North Central71.4
7) Mid Atlantic68.2
8) Pacific64.1
9) New England46.9

Most acceptable in the South, least so in the Northeast. Embers of the Civil War burn on.

And the same, by reported ethnicity. Minimum sample size of 50, though N is much exceeds that for most groups:

Ethnicity%Spank
1) African84.5
2) "American"81.5
3) Native American79.0
4) Scottish78.5
5) Puerto Rican78.3
6) Dutch74.9
7) English/Welsh73.3
8) German73.1
9) French71.3
10) Spanish71.1
11) Mexican69.0
12) Irish68.4
13) Filipino64.5
14) Swedish63.3
15) Italian63.0
16) Chinese61.6
17) Norwegian61.3
18) Indian (dot)59.7
19) Russian59.4
20) Czechoslovakian58.1

White liberals, black rednecks. Those who refer to themselves as "American" are largely Scottish, and unsurprisingly express attitudes similar to those who consider the highlands to be an ancestral homeland. Most people in the US of Russian national descent are Jewish, not little Putins. No idea about the Slavs!

Parenthetically, regarding the question of ethnicity, people much smarter and far more perspicacious than myself have said that in the contemporary US it is basically meaningless. Perhaps as a biological marker, okay, though it does track geographically and it seems to provide some insight into cultural characteristics. My working assumption is to treat it as good--or at least useful--information, and not an enemy of the perfect even if it falls well short of being as much.

Finally, in the comments section of Jayman's post, there is some incredulity about the use of corporal punishment among readers who are from states where it is legal. I suspect that in these states it occurs almost exclusively in private schools, though few if any of the state laws distinguish between public and private in questions of the legal permissibility of the practice.

GSS variables used: SPANKING(1-2)(3-4), YEAR(2000-2012), REGION, ETHNIC(1)(5)(6)(7)(10)(11)(14)(15)(17)(18)(19)(20)(22)(23)(24)(25)(26)(30)(31)(97)

Saturday, October 12, 2013

Although the 2012 GSS did not include any questions on presidential voting plans for the same year, the survey did sneak in a question on presidential approval, querying respondents on whether they approve or disapprove of the way Barack Obama is handling the job of president. Because it's fun and often causes people to make fools of themselves, here are IQ estimates derived from wordsum scores for those approving and disapproving of Obama's performance, presuming an average national IQ of 98 and a standard deviation of 15:

Approve -- 97.7
Disapprove -- 98.5

A nation divided. Race, of course, is a confounding factor. When only non-Hispanic whites are considered:

Approve -- 101.5
Disapprove -- 99.3

Per usual, white leftists could appear more credible in the supercilious scorn they have for their bigoted brethren if they acknowledged as much. Since they're afraid to do so, however, let it be known that Obama's supporters aren't quite as intelligent as his detractors are!

More insightfully, the GSS results provide a useful illustration of what the Derb terms "classic class conflict: the top and the bottom against the middle". The following graph shows Obama's approval/disapproval numbers among members of five categories in which respondents are classified based on their wordsum scores*:


If only I could remain stuck in the middle with you. Unfortunately, stasis appears to be a dream of the past, not the way of the future.

GSS variables used: PRESPOP, WORDSUM(0-3)(4-5)(6)(7-8)(9-10), RACECEN1(1)

* Respondents are broken up into five categories that come to roughly resemble a normal distribution; Really Smarts (wordsum score of 9-10, comprising 13% of the population), Pretty Smarts (7-8, 26%), Normals (6, 22%), Pretty Dumbs (4-5, 27%), and Real Dumbs (0-3, 12%).

Tuesday, October 8, 2013

Trayvon Martin Day

The administration of Carrick high school in Pittsburgh planned and subsequently scrapped "Trayvon Martin Day" in which students would be encouraged to wear hoodies in celebration and remembrance of the dead teenager. The school stepped back after opposition from several parents who publicly expressed concerns over the day, specifically with the consequences it would bring to students who chose not to participate.

If this were a school on Martin Luther King boulevard or in a plush area of Belmont, there would likely still be media 'controversy' surrounding the proposed honorific day, but visceral fears for the safety of the students from parents at said schools probably wouldn't be a part of it.

Why so much worry about violent fallout among the student body at Carrick? Diversity. In addition to strength, it's also social combustibility! A pie chart of the racial composition of Carrick's student body:


Residuals are 5% two or more races, 1% Hispanic, 1% Asian. Despite Zimmerman's Hispanic heritage, his persecution and the coverage surrounding it operated upon the old binary racial template of oppressed black America under the thumb of oppressive white America. Too fitting.

And the school's unsurprising scholastic profile (Carrick students' proficiency rates, Pennsylvania's statewide proficiency rates):

Math -- 38%, 60%
Reading -- 57%, 68%
Science -- 16%, 42%
Writing -- 80%, 83%

Saturday, September 14, 2013

Randall Parker points to a CNBC article focused on unfunded pension liabilities at the state level that is packed with quite a bit of data on the financial condition of the fifty. I've been after something like this for several years.

There are multiple ways to view the numbers, but probably the most broadly informative involves adding together current state debt and unfunded pension liabilities going forward and then looking at these on a per capita basis. That is, determine the dollars each resident of a state is putatively on the hook for at present to pay what the state currently owes and will expect to additionally owe beyond its projected funds on hand. Of course, debt can be defaulted on and promises reneged--realistically, that, in tandem with some combination of currency devaluation, is my best guess for how this unsustainable situation eventually resolves itself, with varying levels of disruption at varying times in the future.

The following table shows per capita debt-plus-future-obligations ("debt" going forward), with the financially healthiest states at the top of the list and the least solvent states at the bottom:

StatePerCap$
1. South Dakota513
2. Tennessee847
3. Idaho969
4. Nebraska1,046
5. North Carolina1,138
6. Texas1,514
7. Wyoming1,982
8. Wisconsin1,982
9. Iowa2,296
10. Florida2,320
11. Missouri2,426
12. Georgia2,436
13. Vermont2,688
14. Arkansas2,695
15. Indiana2,707
16. North Dakota2,726
17. Maine2,756
18. Utah2,785
19. Arizona2,939
20. Washington2,961
21. Oklahoma3,237
22. Delaware3,265
23. South Carolina3,487
24. Michigan3,535
25. New York3,548
26. Minnesota3,606
27. Alabama3,746
28. New Hampshire3,762
29. Virginia4,035
30. Montana4,042
31. West Virginia4,223
32. Pennsylvania4,284
33. Kansas4,402
34. Oregon4,611
35. Nevada4,801
36. Maryland4,864
37. Colorado4,996
38. Louisiana5,205
39. California5,650
40. Mississippi5,882
41. Rhode Island5,901
42. New Mexico6,554
43. Ohio7,025
44. Kentucky7,322
45. Massachusetts7,455
46. New Jersey8,480
47. Illinois9,056
48. Hawaii9,878
49. Connecticut10,776
50. Alaska12,363

A visualization of the data with figures is available here, and is reproduced without interaction below:


No blatant trends jump out. Sparsely populated, mostly white flyover states in close proximity of Canada tend to be in the best shape, with the major exception of Alaska. Thank goodness for that petroleum dividend--suspend payouts for a decade or so and the problem is solved!

Illinois, the nation's most demographically representative state, similarly serves as one of the states that comes closest to serving as a microcosm for the nation as a whole, though even it comes up well short. While Illinois' residents are looking at a little north of $9,000 in debt peonage per, these state-level obligations pale in comparison to the debts and empty promises of the federal government, for which debt alone is currently running over $50,000 per person.

The article opens by attributing Detroit's municipal bankruptcy to "underfunded retirement promises to public sector workers". Tautologically so, but no doubt haters have made attributions of their own that are hatefully racist and racially hateful. The correlation between a state's Ice People (non-Hispanic white + Asian) population percentage and its debt is an inverse .21. It runs in the direction haters expect it to run in, though it's a tepid relationship.

How about something to Sean Hannity's taste? The correlation between debt and Obama's share of the 2012 presidential vote is a more robust .39. Blue states really do tend to be less fiscally responsible than red states even though blue states generally have more human capital to work with.

Speaking of human capital, the inverse correlation between debt and estimated state IQ is a statistically insignificant .06. The relationship between median age and debt is more feeble still, at .03. It might be nice to think that the states that have the most time to formulate viable solutions before the bills start coming due en masse are the ones who need that time the most, but alas it isn't so.

In addition to having, on average, modestly less intelligent populations than blue states, red states also tend to be fatter. In light (heh) of the above, then, it comes as little surprise that debt and obesity inversely correlate at .23. In this case, it looks like it's possible to have your cake and eat it, too--those public service health campaigns in Connecticut aren't doing the nutmeg state's bottom line any good!

Parenthetically, as a supporter of full Puerto Rican independence, I can now point to the fact that the island's per capita debt, at $12,487, is higher than that of any state in the union. While Puerto Ricans may not be as affluent as Americans, they're even better at spending money they don't have than we are. Really, what do they need us for?

Thursday, September 5, 2013

NAEP scores and demographics galore

Previously, this provincial took a look at the relationship between scholastic performance and student body racial composition for the two most populous counties on the Kansas side of the KCMO metro area. Let's do the same but this time at the national level, replacing individual schools with states and using data from the National Assessment of Educational Progress (NAEP).

The y-axis shows the percentages of each state's public school student bodies that are either non-Hispanic white or Asian (Ice students). The x-axis shows the amalgamated math and reading section scores from the 8th grade NAEP, administered in 2011:


The correlation between Ice student body percentage and combined math and reading scores is a positive .64 (p = .0000003). That's a pretty strong relationship for the social sciences, though it is not as nearly perfectly rigorous as the two-county correlation of .93 is. That's hardly surprising--the differences between the white population of Massachusetts and the white population of West Virginia are more numerous and more substantial than are the differences between the white populations of Olathe and Overland Park.

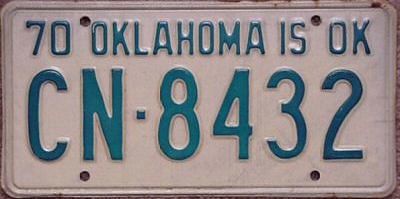
The farther below the green linear trend line a state falls, the 'better' it is performing relative to what the racial composition of its student body alone would predict. Conversely, the higher above the trend line a state floats, the 'worse' it is doing relative to what race alone would predict. West Virginia, predictably, looks awful. Evidence of the "Texas miracle" is manifest as well. Older Okie license plates hearken back to a time when average was, well, average, rather than an affront to a thing's dignity and self esteem. They read: Oklahoma is Ok. Indeed it is. Broadly speaking, the South puts on sub-par performances while the mid-Atlantic looks pretty good. Not a shocker to people who've read Albion's Seed. Perhaps less predictably, however, is the fact that with the exception of the sterling state of Massachusetts, New England is rather underwhelming.

Racial classification--being the broad, fuzzy concept that it is--isn't definitive, of course. Other disparate considerations like population density, culture, socioeconomic status, geography, ethnicity--hell, maybe even teaching tactics and classroom size--influence testing results. If race was everything, the correlation would be a perfect 1.0. That said, race is definitely predictive, and consequently it matters quite a bit.

Tangentially, interpreting the entrails of this graph, allow me to audaciously play augur and predict that within a generation, Texas, Arizona, Florida, Georgia, Louisiana, and, most boldly, Mississippi, will all be irretrievably lost to the GOP and will have become reliably blue states--final nails in the coffin of a moribund Republican party, unless it is somehow able to win over upper Midwest states like Minnesota, Iowa, Wisconsin, Michigan, Ohio, and Pennsylvania as compensation in the interim. I'm not putting my money on it.

Monday, August 12, 2013

Authentic Dotte

++Addition++Thanks to Jokah's astuteness, I've included graphical representations of two data points that I hadn't previously specified (though I did use them in the regression calculations). Additionally, I confused the axes and inadvertently left out Turner high school in the initial post. The former was an easy cosmetic fix (but nonetheless the fix to a sloppy error on my part).

As the most integrated public high school in the two county region, I was worried Turner's inclusion might contradict the editorial thrust of the post and make me look like a clown for being so hasty. Fortunately for my credibility, Turner's results are exactly in line with the data from the other 22 schools. The correlation between a school's Ice people percentage and its combined math/reading scores remains an astounding .93 (p = .0000000001, three times more certain than before!). Here is the updated graph:


Sumner, the selective and best performing Sunny school under consideration, is regularly held up as some sort of educational polestar for the state of Kansas. Wikipedia relays some of the accolades the school has enjoyed in recent years:
In the May 16, 2005 issue of Newsweek Magazine, Sumner Academy was named 75th in the "100 Best High Schools in America." This was the second time Sumner Academy was placed on the list. In 2004, Sumner Academy was listed in 99th place. As of 2008, Sumner Academy was named the 183rd best high school in America by Newsweek Magazine. As of December 2009 Sumner Academy was ranked the 69th best high school in the nation, reported by U.S. News & World Report, making Sumner the only high school in the state of Kansas to make the top 100 list.
It does well for having a student body that is mostly comprised of NAMs, but it does considerably worse than any of the largely white high schools in the area, even the the ones with the dumpiest reputations.

In MG's world, Sumner's relatively strong performance would indeed be a potential cause of celebration (though upon closer inspection it would almost certainly become clear that said relatively strong performance is primarily a result of skimming the cream of the surrounding NAM crop and consequently not something that could be replicated over any geographically concentrated area). In reality, though, few people are aware of how underwhelming Sumner's test results are. From all the hype I've heard, I must naively confess to being surprised at the scholastic results once I actually started digging. I've lived in this area since elementary school and have been aware of Sumner's existence and putative profile for at least a decade but never dug any deeper than the second-hand media reports on the school's purported success. I subconsciously assumed it was roughly on par with the leafy, suburban high schools in southern Johnson county. Shame on me for being fooled again. The count is well beyond two, by the way!

---

I'm getting provincial here, but at the moment location, location, location is what I'm focused on. Anyhow, the graph* above serves as a fairly representative microcosm of how things are outside of my neck of the woods. The graph above shows how the 23 public high schools in the two most populous counties on the Kansas-side of the KC metro area fare on scholastic testing** (x-axis) as well as the percentages of students in each high school who are Ice people. The correlation between a high school's Ice people percentage and its amalgamated math/reading score is a staggering .93 (p = .0000000003). That is, 87% of a school's performance can be predicted by the racial composition of its student body alone.


Race matters, oh how race matters. As our fearless leaders keep telling us, we really do need to have an honest conversation about it. It's long overdue.

The most conspicuous outlier, Sumner Academy, is a magnet school in the Wyandotte district that pulls the more promising kids out of the clump of schools huddled at bottom left of the graph. Even the Dotte's wheat is less luscious than Joco's chaff, though.

Lest I be fingered as a prestidigtator artificially creating a yin-yang contrast by taking one of the most affluent counties in the Midwest and putting it up against one of the Sunniest ones, the correlation between Ice % and reading/math average scores in the Johnson County schools alone--those, with the exception of Bonner Springs, populating the top right cluster of the graph--is still a rigorous .82 (p = .0002).

Parenthetically, it should also be noted that Ice, in this case, refers overwhelmingly to non-Hispanic whites, while Sun is almost equally split among blacks and Hispanics with "other" (primarily Native American and 2+ races) making up the remaining fraction. The mean composition of the high schools under consideration is 62.6% white, 15.2% black, 14.5% Hispanic, 4.1% Asian, and 3.6% other.

Mentioning Mark Zuckerberg, the multi-millionaires running Microsoft, and the rest of Silicon Valley's executives in a post like this might seem utterly orthogonal at a stretch, but upon closer inspection, tangential doesn't even do such a mention justice. See, by loaning their prestige and pocket books to the crusade for open borders, the patriots at FWD.us are able to ensure a dumbing down of the nation's students--and, by extension, its schools--thereby giving an ever-thickening air of legitimacy to their lamentations about having a suboptimal domestic labor pool from which to hire from. Virtuous circle, that!

* Taken from an old version of excel and dressed up in... Paint. Apologies for lack of aesthetic crispness.

** Calculated by averaging the percentage of students who are deemed as being up to standards (ie, proficient) on the math and reading sections of the 2011 Kansas State Assessments.

^ For the locals, I am aware that, geographically, the farther south one travels, the Icier the population tends to become and that, conversely, the farther north one heads, the Sunnier the natives are. Directions in the graph's title are meant to be normative rather than directional.

Thursday, July 11, 2013

For my 30th birthday, Rasmussen conducted a straightforward poll on perceived racism in the US by race. The results:
Thirty-seven percent (37%) of American Adults think most black Americans are racist, according to a new Rasmussen Reports national telephone survey. Just 15% consider most white Americans racist, while 18% say the same of most Hispanic Americans.

...

Among black Americans, 31% think most blacks are racist, while 24% consider most whites racist and 15% view most Hispanics that way.

Among white adults, 10% think most white Americans are racist; 38% believe most blacks are racist, and 17% say most Hispanics are racist.
The reaction on the left (to the extent that it the poll has been acknowledged at all) has been predictably dismissive and disparaging of Rasmussen as an organization. Individuals aren't the only ones susceptible to Watsoning or Richwining.

Note that these results are not merely due to each group thinking other groups are more racist than they themselves are--even blacks recognize blacks to be more racist than are whites or Hispanics. The high standing in pop culture of a Chris Rock, anyone? I don't need to detail the double standard on display here--if a white comedian was to be one-tenth as candid about race as Rock is, he'd be blacklisted by the entire entertainment wing of the Cathedral and forced to exist exclusively on the internet if he existed at all. Speaking of double standards, racial epithets are of course off limits for some groups but not so much for others. And on and on and on.

The data, to the extent that they are gathered, confirms as much. In the 2008 Democratic primaries, when the media narrative revolved around whether or not whites would vote for a black candidate or not--we're talking Barack Obama and Hillary Clinton here--exit polling clearly showed that even (especially?) among Democrats, blacks were more influenced by the races of the candidates than whites were, and of course blacks voted overwhelmingly for Obama. In 2004, the GSS showed blacks to be nearly four times as likely as whites were to choose race as one of the three most important ways they self-identify from a list of ten possible choices.

As a self-styled race realist, the term "racist" is a difficult one for me to define with much utility. What is generally considered to be "racist" in polite 21st century American parlance would be, in a sane world, prefixed by the adverb "irrationally"--someone who despises an affable, industrious black man for no other reason than the color of his skin fits this definition, for example. A rational racism (or rational racialism), in contrast, is the more common and commonsensical realization that, on average, different groups of people behave differently from one another and have different characteristics than other groups of people do, and consequently said groups shouldn't be presumed to be indistinguishable from one another. In reality, though, both varieties of racism are merged under the umbrella term "racism" in which rational variety of racism is at least as despicable as irrational variety is (if not worse, as the Cathedral is aware that the former aligns strikingly well with the information people's own lying eyes are conveying to them and is, as a consequence, more threatening than the latter, which just sounds off-putting and buffoonish).

That digression aside, these results should come as little surprise to red pill poppers. Blacks are perpetually encouraged, from both within the 'black community' and from without, to view everything that happens around them through a racial lens. More recently, Hispanics have been offered similarly tinted spectacles, but as Hispanics in the US are, relative to blacks, less pathological, racially more dissimilar, and less civically engaged, the results haven't been nearly as 'effective' (at least not yet--give it a couple more amnesties and majority-minority status and we'll revisit my evaluation).

As the Inductivist illustrated years ago, the less prosperous and less put together a racial or ethnic group is, the more pride (and thus more awareness) it has in being member to said race or ethnicity. Well, blacks are the least prosperous, least put together racial group in the country. The very starkness of this black failure accentuates black racism by making it so blatantly obvious to blacks and non-blacks alike--if only whispered in private in the case of the latter--that blacks are underachievers. Always have been, always will be?

Blacks have more historical grievances to air against the (former) WASP majority than other minority groups do, so their moral claim to victimhood putatively dwarfs that of other groups. Use what you've got and exploit that white guilt to the hilt! Never mind that not only today do whites (and other non-blacks) have far more to fear from blacks than blacks do from whites (or other non-blacks), it's also highly probable that in all of the nation's history, blacks have killed more whites than whites have killed blacks*.

In closing, note that becoming the most powerful person in the world isn't enough--not nearly enough, and quite possibly counterproductive--to reduce perceptions of racial tension in the US:
Overall, just 30% of all Americans now rate race relations in the United States as good or excellent. Fourteen percent (14%) describe them as poor. Twenty-nine percent (29%) think race relations are getting better, while 32% believe they are getting worse. Thirty-five percent (35%) feel they are staying about the same.
It never ends. It just gets worse. Really, though, in the words of that great sage, what do we expect when, upon finding ourselves in a hole, our collective solution is to keep on digging?

* Doing back-of-the-envelope calculations, the contemporary figures show that each year around 1,500 more whites are killed by blacks in the US than blacks are killed by whites (homicidally, that is). In contrast, in the 85 years from 1882 to 1968--the era of Jim Crow laws--there was a total of just under 3,500 lynchings of blacks (presumably almost exclusively by whites). Okay, so maybe in the last decade blacks have spilled more white blood than whites spilled black blood in the first couple of centuries of the country's existence, but we're talking about lynching here for crying out loud, what could be more brutal than that?! Well, I'm no expert, but I think if I had to pick my poison I'd opt for hanging over this.

Monday, June 10, 2013

Geography, race, religion, and class

... is a ridiculously audacious title for the post it introduces.

Anyway, previously, Dan commented:
Poor inner city people go to church more than everyone else, and they theoretically believe in marriage. But they don't believe in losing the government checks.
Having read Charles Murray's Coming Apart, that assertion struck me as inaccurate, with the caveat in mind that, as Murray did through most of The Bell Curve, so as to avoid racial confounding, the relevant research includes only whites. I did a quick check of the GSS, confirming what Murray found--affluent people from rural and suburban areas go to church more than poor urban folks do.

However, Dan correctly pointed out that blacks attend worship services at significantly higher rates than whites do.

I ran the same GSS test, this time for whites exclusively and for blacks exclusively and found the same patterns for both racial groups--wealthy suburban and rural blacks go to church more than poor inner-city blacks do, and wealthy suburban and rural whites attend more than poor inner-city whites do. The rub is that poor urban blacks still attend more than wealthy suburban and rural whites do. Here are the averages. The higher the figure, the more frequently the group attends worship services (n = 2,468, one SD = 2.76):

GroupAttend
Wealthy country blacks5.64
Poor urban blacks4.12
Wealthy country whites3.59
Poor urban whites3.24

The "wealthy country blacks" row is only comprised of 23 respondents, so take it with caution, but the overall results pass the smell test.

If Dan's in error, it is in the assumption that urban poor = black. While the urban poor are far more likely to be black than the rest of the country is, in absolute terms I don't think blacks comprise an absolute majority of the country's poor city dwellers. As an empirical question, it's tough to get a straight answer because the definitions of "urban" and "poor" aren't standardized, with the idea of "urban" being a lot more expansive at the US Census office than the idea of "ghetto" is in the vernacular.

GSS variables used: RES16(1-4)(6), REALINC(0-30000)(100000-999999), YEAR(2000-2010), ATTEND, RACECEN1(1)(2)

Sunday, May 19, 2013

I recall a couple years back reading about the state of Florida's implementation of a plan requiring aspiring recipients of welfare cash assistance (TANF, specifically) to take and pass a drug test to become eligible for said benefits. If successful, the state reimburses the welfare recipients for the cost of the drug test. If they fail, benefits are withheld and the test-takers are on the hook for the cost of having it administered.

Media coverage insinuated that drug usage among welfare recipients was, contrary to Florida governor Rick Scott's claim that welfare recipients have higher rates of drug use than non-recipients do, quite low--perhaps lower than that of the broader population--as less than 3% of those who went ahead and had a test administered on themselves failed to pass it clean. The hole in this implication, of course, is that many of those who qualify for welfare but have recently used drugs aren't going to drop the cash to take a drug test they know they're going to fail. One could make the argument that the more surprising result is that 1 in 40 willingly paid to have a drug test administered on themselves for no reason. Maybe they thought the test would fail, or perhaps these are people on the bottom rungs of the societal ladder and are consequently not well known for high conscientiousness or foresight.

There's a little bankshot in Scott's plan, as it disincentivizes drug usage among the poor while simultaneously reducing the number of people who are eligible to receive benefits by putting another hurdle in their way.

Since then, I stumbled across the 2011 National Survey on Drug Use and Health, with free online access available through the SDA interface. Unfortunately, the closest the study gets to querying respondents on welfare recipiency is whether or not they (or their families, for minors) are eligible for Medicaid (20% of participants said they were, 80% said they were not--I suspect those potentially eligible but who've never actually used Medicaid are mostly unaware of their eligibility or unwilling to take advantage of it for whatever reason, so I'd guess we're doing more than just proxying for low income here), and that question can only be cross referenced with "have you ever used X?" inquiries, not "have you used X in the last month?" questions.

Thus the following attempt to get a feel for whether welfare recipients are more or less likely to use illicit drugs than non-recipients are is a pretty rough approximation, but we work with what we have. To give participants a chance to have used the various stuff if so inclined to do so, I excluded respondents under the age of 20.

The percentages who have ever smoked marijuana by whether they are eligible or ineligible for Medicaid:

Weed%Used
Eligible41.5
Ineligible44.9

Crack:

Crack%Used
Eligible36.7
Ineligible21.1

Cocaine (powdered):

Coke%Used
Eligible17.9
Ineligible16.2

Heroin:

Heroin%Used
Eligible3.7
Ineligible1.7

LSD:

LSD%Used
Eligible60.6
Ineligible65.6

Methamphetamine:

Meth%Used
Eligible61.8
Ineligible52.5

Negligible differences between those eligible for Medicaid and those ineligible when it comes to weed and powdered cocaine, higher rates of having used crack, heroin, and meth among the eligible, and higher rates among the ineligible when it comes to having ever tripped on acid.

Crack is a black drug and meth is a white trash drug. Powdered cocaine and heroin are a little, uh, classier, acid is for the college-aged children of the middle class and the affluent who are on existential missions to find themselves, and weed is something people from all walks of life have used sometime in their adolescent and early adult years.

Parenthetically, if I'm able to use the data at hand to validate some of the stereotypes I'm asserting in the body of a post, I better do so. The percentages of respondents, by race, who've ever smoked crack:

Race%Used
White20.0
Black51.0
Hispanic17.1
Asian28.0

And used meth:

Race%Used
White52.3
Black47.8
Hispanic55.9
Asian63.6

GSS variables used: NEWRACE2, AGE2(9-17), MJEVER, COCEVER (fag!), CRKEVER, HEREVER (...better), LSD, METHDES

* I realize the usage figures for meth and LSD strain credulity, apparently being more experimented with than even marijuana. I'm unsure of why this is the case, but I doubled-checked the figures and that's what the results show, so take the meth data with a grain of your favorite substance. It's probably still worth noting the disparity between those eligible and ineligible for Medicaid, though.

++Addition++Dan shows how wildly off the meth (and by extension LSD) numbers are. The LSD and meth questions are grouped in under larger categories for hallucinogens and amphetamines, respectively, so it's probably "if you have ever used a hallucinogen, have you used LSD?", etc. Consequently, the racial distribution for meth use likely only applies to those who've used amphetamines of some kind. I'm fairly confident about the figures for the other drugs, though.

Monday, April 1, 2013

Skin tone and IQ, and volunteering, too

The 2012 data from the GSS has been released for public consumption. Apparently (and beautifully) oblivious to PC etiquette, the GSS asked interviewers to assess the skin tones of the survey respondents they interviewed. The following graph shows the relationship between skin tone and wordsum results, a quick ten question vocabulary test that correlates pretty well with IQ (n = 1,119):


There is some noise on the dark end due to small sample sizes in the 8-10 range. Excepting that, we get confirmation of the stereotype that ice people are more, uh, bookish than hipper sun people are.

To get under leftists' skin (heh) even more, the percentages of people who have volunteered through or for an organization over the last year, by political orientation:

PolsVols
Liberal40.6%
Moderate35.5%
Conservative49.0%

When it comes to volunteerism, one of our demographic groups is assimilating to the norms of old America. The other? Not so much. By race:

RaceVols
White41.0%
Black39.7%
Asian40.3%
Hispanic26.7%

Morality doesn't need religion! Humanism is my religion! Just because you go to church on Sunday doesn't make you a good person! Volunteerism over the last year, by frequency of worship attendance:

AttendVols
Never21.7%
Less than monthly36.2%
Less than weekly43.7%
Weekly+60.4%

GSS variables used: WORDSUM, RATETONE, POLVIEWS(1-3)(4)(5-7), VOLACTYR, RACECEN1(1)(2)(4-10)(15-16), ATTEND(0)(1-3)(4-6)(7-8)

Saturday, March 9, 2013

Self-assessed health by race, age, and sex

Despite the claims that low educational attainment among blacks relative to whites is in large part due to blacks feeling intellectually inferior to whites (known in the academic literature as "stereotype threat"), the data actually show blacks to be as confident in themselves--if not more so--than are whites (and other non-blacks).

I wondered how similar the story would be when it came to questions of health. Black athletic prowess is possibly the least 'controversial' HBD-related topic to broach in the US. On the other hand, contemporary life expectancy is lower for blacks than non-blacks, and black obesity rates are higher than white rates are.

The 2011 National Survey on Drug Use and Health asked respondents to self-assess their personal health. The following graph shows the percentages who described themselves as being in "excellent" or "very good" health, by race (white refers to non-Hispanic white, black to non-Hispanic black, etc):


The health problems afflicting Native Americans are fairly well known among the general public, and they are familiar among feather Indians as well, as the survey results illustrate. Hispanic laconic demurity notwithstanding and with a pinch of apparent hybrid vigor, it appears that self-assessments roughly approximate actual outcomes--ice people tend to enjoy better health than sun people do.

For stereotype validation that rests on more certain ground, consider self-assessed health by age range. Again, the percentages describing themselves as being in "excellent" or "very good" health:


Finally, there isn't much difference between Venus and Mars on this one. By sex:


NSDUH variables used: NEWRACE2(1)(2)(3)(4-5)(6)(7), HEALTH(1-2)(3-5), IRSEX(1)(2), AGED(1-7)(8-11)(12-13)

Monday, March 4, 2013

Menthol preference by race

Some follow up on the previous post looking at racial distributions of smokers of the top cigarette brands in the US. Firstly, a couple of commenters asserted that Parliaments are the SWPL brand of choice. Here's the breakdown:


Primarily white with a nice Asian showing and a correspondingly weak NAM share. Looks like we have a winner. Rescued pit bulls suffer secondhand smoke from Newports and then from Parliaments, poor creatures.

Secondly, Billy Bob noted the accusation that by disguising the harshness of cigarette smoke, menthol-flavored cigarettes encourage younger people to take up the vice who might otherwise not if their options were limited to non-menthol options. The FDA applied the same line of reasoning when it banned the sale of other flavored cigarettes in 2009.

Fortunately, the NSHDU survey asked participants whether they've primarily smoked menthols or non-menthols in the past month. Cross referencing these responses to the age ranges of said respondents allows us to look at the relationship of age and menthol preference among smokers. The following graph shows the percentages of smokers who primarily smoked menthols in the last month by age range (and specific age, to the extent the survey data allows for it to be reported). To avoid racial confounding, only non-Hispanic whites are considered:


Tough to argue with the claim that younger smokers are relatively more inclined towards menthols than older (and, by extension, more veteran) smokers are. There is some expected noise, especially among 12 and 13 year-olds, but the trend is clear. The question of whether or not young smokers who take up menthols would be willing to smoke non-menthols at the same age remains, but surely some portion of them would not be apt to do so. Seems plausible to presume that banning menthols would reduce smoking rates (obviously), but more importantly, would disproportionately reduce smoking rates among young people.

There is a racial component to the question of banning menthols, of course. Namely, blacks of all ages are far more likely to smoke menthols than non-blacks are. The following graph shows the menthol/non-menthol distribution of smokers by race:


The idea of banning menthols is akin to prosecuting crack cocaine more aggressively than powder cocaine, and that sets off all kinds of PC alarm bells.

National Survey on Health and Drug Use variables used: CIG30MEN, AGE2, CIG30BR2(120), NEWRACE2(1)(2)(3)(4-5)(6)(7)

Thursday, February 28, 2013

Counting blue gods

Like children often do, I have many questions. To the GSS I say, "Tell me all your thoughts on God". The following graphs show the percentage distributions for four categories of theistic belief across a host of usual-suspect variables. For contemporary relevance, all results are from 2000 onward. By race:


By sex:

 By political orientation:
By partisan affiliation:


By community type at the age of 16:


By social class:


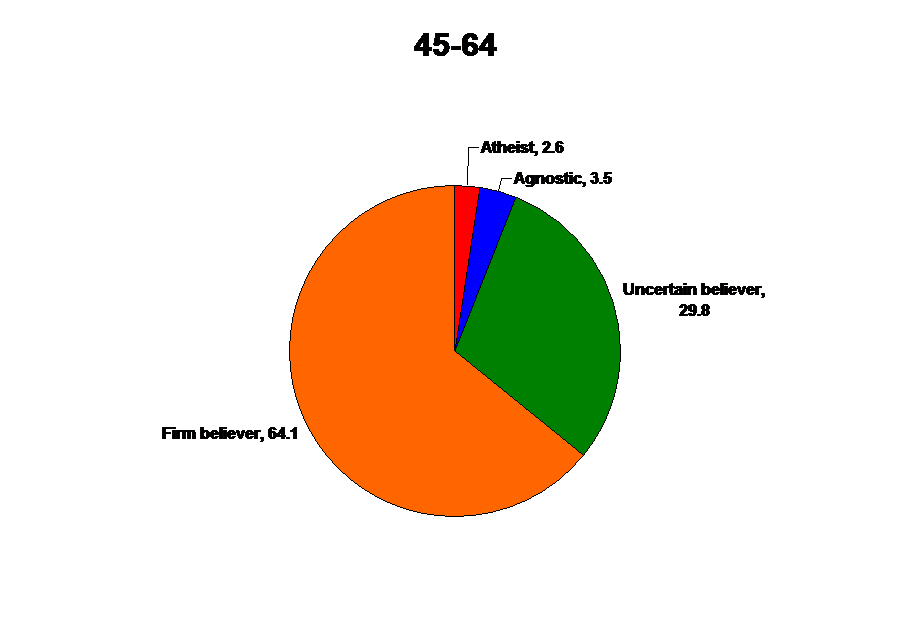
By age range:


By intelligence*:


By educational attainment:


The quintessential atheist is a high IQ, upper class, urban, white (or Asian), young, liberal Democratic guy with a doctorate. Firm belief is pretty much the norm across the board and a plurality just about anyway one broadly slices it, but the further one moves away from the quintessential atheist, the more theistic things become.

GSS variables used: GOD(1)(2)(3-5)(6), RACECEN1(1)(2)(4-10)(15-16), SEX(1)(2), POLVIEWS(1-3)(4)(5-7), PARTYID(0-2)(3)(4-6), RES16(1-2)(3-4)(5-6), CLASS, AGE(18-29)(30-44)(45-64)(65-89), -WORDSUM(0-3)(4-5)(6)(7-8)(9-10), EDUC(0-11)(12)(13-15)(16-17)(18-20), YEAR(2000-2010)

* For intelligence, respondents are broken up into five categories that come to roughly resemble a normal distribution; Really Smarts (wordsum score of 9-10, comprising 13% of the population), Pretty Smarts (7-8, 26%), Normals (6, 22%), Pretty Dumbs (4-5, 27%), and Real Dumbs (0-3, 12%).
ban nha mat pho ha noi bán nhà mặt phố hà nội