RSS
Facebook
Twitter

Showing posts with label Class. Show all posts

Wednesday, November 27, 2013

Poor people's poor sense

Cross-posted at HuffPo

This post will appear lacking in systematic structure because poor people tend to be fatalistic. Low future time orientation and few social obligations combine to create an existence that seems impulsive and chaotic from vantage points higher up the ladder. We look at the poverty and pretend to wonder why. We know the what and the how, we can see all the decisions and behaviors that precede the seemingly intractable problems, but it’s rare to have someone actually explain the why without resorting to epicycles and all the pretty lies that accompany them.

Social obligations are the millstones the middle and upper classes refuse to take off their necks. Voluntarily so you might say, but many of them don’t even take all the vacation their employers give them, let alone bailing unexpectedly. They force themselves to sleep before they really want to and then set obnoxious alarms that force them out of bed long before the sun is up. They juggle school, work, church, sports games, civic activities, and on and on—I don’t do many of these things, and none of them with any consistency. I’d rather just mill around in public places, maybe playing a knockout game here or a joining a flash mob there. I’m not married, but if I ever do tie the knot, it’s a good bet that I’ll cut that knot long before my avowed obligations expire. I have plenty of time to think about what I’m doing, but it’s not in my constitution to do so. Planning isn’t in the mix.

I’m coming off as far more eloquent and articulate than I actually am because my thoughts are being edited by someone who reads more books in a month than I will in my entire life. I don’t know what words like “pact” and “animosity” mean, though I do use the word “fuck” a lot, and quite creatively to boot—as a verb, an adjective, a noun, and an of course as onomatopoeia.

I don’t remember the first time I got pregnant. I was bouncing back and forth between my abusive baby daddy and my mom’s apartment. He wasn’t faithful but he was good in bed and shared with me the money he made in exchange for the WIC and EBT benefits I got for being a single mother without any reported income. I like to smoke and drink, and the things science says are changing all the time anyway, so I wasn’t going to stop just because my menstrual cycle had.

Yeah, I have the time to cook, I already said that. But that’s hard, boring work and getting fresh meat and produce means going all the way to the grocery store two miles down the road. There’s a convenient store in walking distance just around the corner where I can get Red Bull and Bomb Burritos with a swipe of my freeBT card. They even have a microwave so I can heat the food up after you buy it for me. I have time to clean, too, but I don’t do that either, so a lot of creepy crawly things live with me.

I try to live like I have the purchasing power of someone in the middle class, but I lack the prerequisite combination of intelligence, executive function, and shrewdness to procure the resources required to enjoy said purchasing power on my own. Better not to try. In fact, the less I try, the easier it is to have the state provide that purchasing power for me. Why would I give up time for sensual pleasures like junk food, nicotine, and spontaneous sex to engage in creating value for someone else? Those working class stiffs need a stiff drink, that’s what they need.

I live in a vibrant area and consequently there are a couple of Planned Parenthood centers amidst the conurbation I stomp around in, but even if I lived three hours away from the nearest one, the profiteering not-for-profit do-gooders and their government enablers who run PP would happily cover my travel costs.

Our society spends way too much time and effort medically remediating a whole host of conditions that our ancestors hardly knew. There are drugs for everything. Blue bloods doctor shop for the prescriptions they want, but I have my own contacts on the ground for getting the stuff whenever I want it. I don’t get vacation per se, but I get a lot more time off than my social betters do. If I was able or even wanted to spend all that excess free time working, I wouldn’t be poor, after all.

I think I’d make a great movie star and do even better with a reality show, but I can’t even get a job as a waitress (though I have enjoyed my 15 minutes of fame here—twice!) because I have stained teeth and it looks like I used to chew on rocks, my BMI is over 30 but an ignorant outsider could be forgiven for mistakenly believing my wardrobe belonged to someone half my size, I shower irregularly and often don’t wash my hair when I do, and when I inevitably make an error on the application I fill out, I don’t have the patience to grab a new one but instead scratch out the mistake and write the correct thing in wherever I can find room.

Beauty is a thing you get when you’re a post-pubescent teenager. After that, you have to work to keep it. And, well, you already know how I feel about work.

Meth makes you overly alert to everything. Before Breaking Bad, nobody realized that. I’ve spent a lot of hours telling cashiers about all the things I need to take care of like right now, haha, sorry, *itch* I also want that, I get so forgetful, sorry *scratch* yeah sure that’s fine haha ohwheredidIputthatohhahaIputitoverthere. If only it would lead me to pull up my sleeves and get my shit together like it pulls back the skin on my face. It doesn’t work, but that is tweaking.

“Free” is only enticing if the object in question is something you want. It’s great that there are free condom giveaways in the convenient stores where I buy my bread (not by the loaf, rather one cinnamon-and-sugar topped roll at a time), but sex doesn’t feel as good with those things on.

Clinics? Specialists? Co-pays? Seriously?! Might as well be speaking Greek to me. If something’s wrong, I’ll go to the ER. They’ll see me anytime day or night, and they don’t make me do a bunch of stuff ahead of time or force me to produce an insurance card.

I smoke. It’s expensive. Okay, you’re with me on that one. If I justified it by feeding you a line about how it is the battery to my Energizer Bunny and then in the same paragraph called it a source of relaxation, well—what’s that? Ah yes, lack of structure, chaotic, impulsive—now you’re seeing exactly what I mean.

You might think I make a lot of poor financial decisions, but that’s because you’re so concerned with the past and the future that you’re forgetting about how I’m feeling in the present, too obsessed with gathering ideas of how it’ll all inevitably end for me. But if all it takes is a swipe of this piece of plastic to sate my appetites, what kind of sucker would I be not to take advantage? There’s an indefatigable pull to spend any money I can get my hands on before it burns a hole in my pocket. Look what being responsible gets you—a bunch of extra zeroes in your bank account that you never let yourself enjoy? And don’t get supercilious about your knowledge of financial instruments, blue blood. I know more about money orders and payday loans than you do, and I've played these same numbers for the last four months so I'm due to hit the jackpot any day now.

Understanding that I lack the long-term orientation we mentioned earlier, it should be easy to understand why you see people like me with four different baby daddies instead of one husband and father. We skip on the abortion because the irresistible pull that made us feel worthwhile at the time is something we can have over and over again afterwards just by letting nature take its course. Compromise isn’t our thing so we’re rarely compatible for the long-term, but carnality can keep us together for a couple of months, or at least a few hours anyway. It does not matter what will happen in a month. We don’t plan long-term because we’re fly, you ain’t cause you not. We take what we can as we spot it.

I’m not asking for sympathy (but I am asking for money. Have any to spare? God bless!), I’m just trying to explain, through parody, some of the many ways members of the Cathedral and their Great And Good Votaries deny empirical, ‘ugly’ realities in favor of self-serving pretty lies. Dive into the links provided and then take a gander at the interactive General Social Survey site to get a sense of what life is like in the Dark Enlightenment and a feel for the mechanisms that red-pill poppers employ in an effort to understand the world as it is rather than as we might wish it be. It’s certainly self-defeating, but it’s nobler.

GSS variables used: OWNFATE, REALINC(0-20000)(20001-999999), WORDSUM, NUMMEN, MARITAL, SMOKE, INTRWGHT, RACECEN1, GOVAID, JOBYEARS

Saturday, November 9, 2013

Virginia tells

As one of the most demographically representative states in the country, and one with an enormous amount of American history packed into it to boot, the gubernatorial results out of Virginia this week are worth examining as a way of better understanding America's contemporary social landscape.

- Cuccinelli, the Republican, won among whites by a margin (56%-36%) nearly identical to the margin Romney did in the 2012 presidential election (59%-39%). McAullife, the Democrat, similarly won among blacks (90%-8% compared to Obama's 93%-6%). No surprises here. At 72% of the Virginia electorate and shrinking, it is difficult for Republicans to win nationally representative elections without winning 2-to-1 among whites. The exit polling data do not report results for other groups due to insufficient sample size, but it's safe to assume McAullife won among the Hispanic/Asian/other residual about as convincingly as Obama did last year.

- Despite all the political polarization etc etc, the third party pipe dream is becoming less and less tenable as the US becomes less and less non-Hispanic white. Whites are the only people with whom Kang's famous taunt to (or was it Kodos'?) "go ahead, throw your vote away", actually resonates. Sarvis, the libertarian, got over 87% of his votes from whites. Cuccinelli received a strikingly similar share of his total votes from whites, coming in at just under 89%. McAullife, in contrast, received just over half of his votes (54%) from whites. Perhaps the seemingly disparate Democratic coalition breaks apart at some point in the future, but currently whites are the only ones who appear to have any willingness to oppose it.

- Why I think Rand Paul's liberty message has legs to stand on in the future: Sarvis' won nearly 15% of voters under age 30 but less than 6% of those aged 30 and over. Whether or not this is constitutes the making of a deal with the devil, reasonable people will disagree.

- The fat-cats-versus-working-class-union-types dichotomy became antiquated decades ago, not least because of the spending advantage Democrats now regularly enjoy, this election clearly being no exception. The new paradigm pits the top and the bottom in alliance against the middle:


Though he lost the race, Cuccinelli won comfortably among voters in households with annual incomes in the $50k-$100k range, and held his own in the $30k-$50k and $100k-$200k ranges, but was blown out by McAullife both among those earning less than $30k and among those making $200k+.

- Another way to characterize today's political dynamic is to pit the government trough eaters and trough fillers against the government food trough producers, or value transferers vs. value creators. Without the state's DC suburbs, from which almost 1-in-5 voters hailed from, Cuccinelli would've won by nearly the same margin he ended up losing by.

- While arguing that there should be some sort of property ownership requirement as a prerequisite to voting eligibility will figuratively lead to one being tarred-and-feathered to shouts of "no to Jim Crow!", the exit polls offer a more modest tact to take in opposition to universal suffrage, of a less personal nature than that preferred by Howard Stern, but similarly based.

Queried on whether Cuccinelli's positions--fairly described as strongly socially conservative within the parameters of contemporary American politics--were too liberal, too conservative, or just right, 8% of exit poll respondents answered "too liberal". Among this group comprising 8% of the electorate, 77% voted for McAullife! The actions of the 13% who said he was too liberal but still voted for him and to a lesser extent the 9% who said the same while voting for Sarvis are comprehensible, but the only conclusion regarding the vast majority who voted for McAuliffe because Cuccinelli is too liberal is that they simply have no idea what "liberal" or "conservative" means in a political context! These are people who would garner a goose egg (okay, it's multiple choice, but you get the idea) on Pew's Political News IQ test, unable to name the vice president or say which party controls the Senate.

Let's not be too critical of this contingent of utterly clueless voters, though. Chances are, they are quite a vibrantly diverse and diversely vibrant crowd and consequently worthy of reverence (even if--or perhaps especially because!--they come almost exclusively from the bottom part of that top-and-bottom alliance we spoke of earlier).

The reverse probably occurred as well, as there were inevitably a few Cuccinelli voters who said McAullife was "too conservative", but their numbers were too small to be statistically reliable and thus were not reported on.

Saturday, October 12, 2013

Although the 2012 GSS did not include any questions on presidential voting plans for the same year, the survey did sneak in a question on presidential approval, querying respondents on whether they approve or disapprove of the way Barack Obama is handling the job of president. Because it's fun and often causes people to make fools of themselves, here are IQ estimates derived from wordsum scores for those approving and disapproving of Obama's performance, presuming an average national IQ of 98 and a standard deviation of 15:

Approve -- 97.7
Disapprove -- 98.5

A nation divided. Race, of course, is a confounding factor. When only non-Hispanic whites are considered:

Approve -- 101.5
Disapprove -- 99.3

Per usual, white leftists could appear more credible in the supercilious scorn they have for their bigoted brethren if they acknowledged as much. Since they're afraid to do so, however, let it be known that Obama's supporters aren't quite as intelligent as his detractors are!

More insightfully, the GSS results provide a useful illustration of what the Derb terms "classic class conflict: the top and the bottom against the middle". The following graph shows Obama's approval/disapproval numbers among members of five categories in which respondents are classified based on their wordsum scores*:


If only I could remain stuck in the middle with you. Unfortunately, stasis appears to be a dream of the past, not the way of the future.

GSS variables used: PRESPOP, WORDSUM(0-3)(4-5)(6)(7-8)(9-10), RACECEN1(1)

* Respondents are broken up into five categories that come to roughly resemble a normal distribution; Really Smarts (wordsum score of 9-10, comprising 13% of the population), Pretty Smarts (7-8, 26%), Normals (6, 22%), Pretty Dumbs (4-5, 27%), and Real Dumbs (0-3, 12%).

Tuesday, April 30, 2013

Music and class

As someone who enjoys classical music's greatest hits but who has tried and failed on multiple occasions to find an opera without "rock" in front of it that he likes, I felt some validation in revisiting the GSS module in which respondents were queried on the genres of music they like and finding that opera isn't widely enjoyed by any major subset of the population.

Building on Inductivist's famous post where he examined estimated average IQ and musical tastes, the following table shows the percentages of people who said they either "very much like" or "like" (on a five point scale, the others being "mixed feelings", "dislike", and "dislike very much") by self-identified social class. The table is ordered by a classiness index*:

ClassLowerWorkingMiddleUpper
Classical28.244.354.071.7
Show tunes/musicals37.547.158.366.7
Big band48.554.164.270.0
Jazz43.848.853.159.8
Opera15.717.923.530.0
Folk40.242.645.752.1
Reggae33.331.835.939.8
Contemporary rock50.657.457.058.3
Latin29.225.631.828.9
New age16.116.519.117.1
Blues56.055.157.354.4
Oldies66.074.070.167.4
Rap21.311.814.317.2
Easy listening58.262.360.051.1
Heavy metal19.513.210.86.7
Bluegrass61.450.946.443.6
Gospel66.464.153.041.3
Country72.669.055.947.8

The data are from 1993, and over the intervening two decades the death of radio and rise of file sharing has fractured the contemporary music scene (and also fractured the utility of a term like genre to describe music) to the extent that it is probably difficult for casual listeners to identify who the new pioneers of sound are across various genres they don't actively keep themselves familiar with, but the categories are still generally recognizable today, even if many of the musicians who represent them are not.

Of the categories the wrong kinds of white people listen to--metal, bluegrass, country--the latter two are actually pretty popular across class lines, though they display an easily observable prole tilt.

Everyone likes oldies just as I expect I'll like hearing pop 40 stuff from the nineties and oughts when I'm in my later years even though I don't make an effort to hear them today. Nostalgia is potent and pleasurable.

If you want to be taken for a patrician rather than a pleb, make sure to have a ready answer for the question of who is the greatest composer of all time (if you're a lightweight like I am, just answer Bach, Beethoven, or Mozart and you should be fine).

Metal and rap aren't enjoyed by most people, which may go some way in explaining why those are the kinds of music you hear blaring from cars at a stoplight or from your neighbor's basement, as being into either of these marks someone as having 'unique' musical tastes and allows him to express his differentiation from the mainstream. Nor is opera, as aforementioned, widely listened to, leading to a sort of high brow, more tasteful figurative blaring among aficionados.

GSS variables used: CLASS, CLASSICL, MUSICALS, BIGBAND, JAZZ, OPERA, FOLK, REGGAE, CONROCK, LATIN, NEWAGE, BLUES, OLDIES, RAP, MOODEASY, HVYMETAL, BLUGRASS, GOSPEL, COUNTRY

* Computed by taking the percentage of upper class respondents who very much like/like (like) a genre and multiplying it by two, adding the percentage of middle class respondents who like it, subtracting the percentage of working class respondents who like it, and subtracting the percentage of lower class respondents who like it after multiplying that percentage by two.

Thursday, February 28, 2013

Counting blue gods

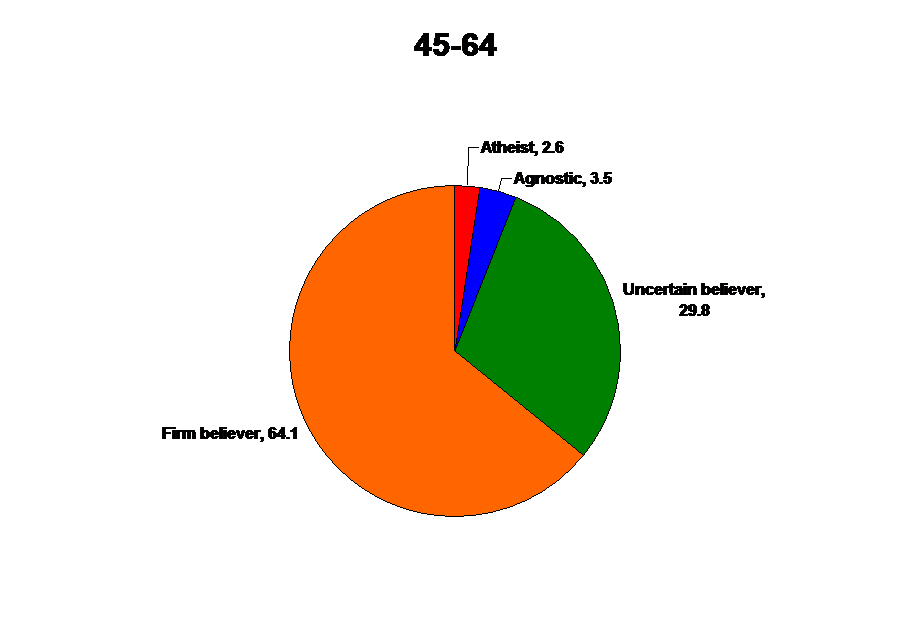
Like children often do, I have many questions. To the GSS I say, "Tell me all your thoughts on God". The following graphs show the percentage distributions for four categories of theistic belief across a host of usual-suspect variables. For contemporary relevance, all results are from 2000 onward. By race:


By sex:

 By political orientation:
By partisan affiliation:


By community type at the age of 16:


By social class:


By age range:


By intelligence*:


By educational attainment:


The quintessential atheist is a high IQ, upper class, urban, white (or Asian), young, liberal Democratic guy with a doctorate. Firm belief is pretty much the norm across the board and a plurality just about anyway one broadly slices it, but the further one moves away from the quintessential atheist, the more theistic things become.

GSS variables used: GOD(1)(2)(3-5)(6), RACECEN1(1)(2)(4-10)(15-16), SEX(1)(2), POLVIEWS(1-3)(4)(5-7), PARTYID(0-2)(3)(4-6), RES16(1-2)(3-4)(5-6), CLASS, AGE(18-29)(30-44)(45-64)(65-89), -WORDSUM(0-3)(4-5)(6)(7-8)(9-10), EDUC(0-11)(12)(13-15)(16-17)(18-20), YEAR(2000-2010)

* For intelligence, respondents are broken up into five categories that come to roughly resemble a normal distribution; Really Smarts (wordsum score of 9-10, comprising 13% of the population), Pretty Smarts (7-8, 26%), Normals (6, 22%), Pretty Dumbs (4-5, 27%), and Real Dumbs (0-3, 12%).

Wednesday, December 5, 2012

Providing procreation predictors, pronto

++Addition++See Jason Malloy's work in the comments.

---

"Have kids" wasn't exactly the right answer to the question of how one finds his way to happy happy village, though "don't have kids" doesn't get the peregrinator any closer, either. But happiness doesn't echo through time, it expires along with its bearer. A question of greater consequence is how we get people to have more (or fewer) children. Okay, it's obvious in a technical sense. But what about a behavioral one?

By way of ordinary least squares, here are the absolute multiple regression coefficients for eleven variables that may reasonably be assumed to have substantial predictive power in terms of realized fertility. For contemporary relevance and to avoid racial confounding, responses are from 2000 onward and only non-Hispanic whites are included. Asterisks indicate statistical significance at 95% confidence.

First, for men, with parenthetical indications of what is associated with greater fecundity:

Marital status -- .37* (marriage = procreation)
Age -- .33* (time = procreation)
Church attendance -- .10* (churchgoing = procreation)
Education -- .07* (less = procreation)
Number of female partners -- .04 (fewer = procreation)
Political orientation -- .03 (conservatism = procreation)
Social class -- .03 (lower = procreation)
IQ (wordsum) -- .01 (intelligence = procreation)
Income -- .01 (less = procreation)
Happiness -- .00 (no relationship)
Belief in God -- .00 (no relationship)

The older a person is, the more time he's had to have kids. Surely age is the strongest predictor of the number of children a man has sired, isn't it? False. Marital status is even more powerful than age is, at least for those with a y-chromosome. Despite rising illegitimacy and declining marriage rates, there is no better* way to get a man to spread his seed than to have him tie the knot. Churchgoing and school-avoiding also push a man towards fatherhood. Nothing else matters much--getting around hurts a smidgen, being conservative helps a bit, but these things only marginally so.

Tangentially, a note to those interested in this sort of stuff: Religious activity tends to be more important than stated religious belief is. Speaking in broad generalities, the man who believes in God but doesn't pray, worship, or otherwise do anything else meaningful as a consequence of that stated belief is behaviorally more similar to an atheist or an agnostic than to a pious person who can reliably be found in the pews on Sunday.

For women:

Age -- .32* (time = procreation)
Marital status -- .24* (marriage = procreation)
Education -- .18* (less = procreation)
Class -- .11* (lower = procreation)
Church attendance -- .07* (churchgoing = procreation)
Political orientation -- .06* (conservatism = procreation)
Belief in God -- .06 (belief = procreation)
IQ (wordsum) -- .04 (stupidity = procreation)
Income -- .02 (less = procreation)
Happiness -- .02 (unhappiness = procreation)
Number of male partners -- .01 (fewer = procreation)

The variables are a more even keel than they are among men, with the only three not mattering much being how much a woman gets around, how happy she is, and how much money she (or her partner) makes. Age is the biggest predictor, followed by marital status, education (a killer of kid creation in the Western world), and then social class, all of which are notably influential.

Affordable family formation (and expressive piety!) isn't just the route to a Republican resurgence, it's the pathway to procreation, too. Societally, of course, we're moving in the opposite direction, as marriage and religious attendance declines while years spent accumulating debt in school instead of creating value in the workforce is still the predominant advice proffered to American youth. Forty more years!

GSS variables used: YEAR(2000-2010), SEX, RACECEN1(1), MARITAL, AGE, EDUC, CLASS, ATTEND, POLVIEWS, GOD, WORDSUM, CONINC, HAPPY, NUMMEN, NUMWOMEN

* With the obligatory qualification that correlation does not necessarily prove causation and is in this context best thought of as merely suggestive.

Saturday, December 1, 2012

Occupations by social class

Half Sigma's post describing teaching as the quintessential middle class occupation naturally made me wonder what, precisely, the most middling profession is. HS writes:
Teaching is not the highest class of profession, but I don’t really characterize it as blue-collar. I have always considered teaching to be the quintessential middle-class occupation. “Top” college graduates aspire to upper-middle-class occupations, so that’s why they aren’t interested in teaching.

Evidence of teaching being almost as low class as nursing is that a lot of teachers are married to cops (according to an online forum).
It's important to make a distinction between the phrase "middle class" and the middle of the class continuum. There are four major classifications of social class in the contemporary US--upper class, middle class, working class, and lower/under class. There are of course gradations within these four (upper middle class, middle upper class, lower middle class, etc), but these are the four the GSS uses, and they're the four I'm going to employ here. As the breakdown is basically 5%-45%-45%-5%, respectively, to be solidly middle class is to be of 'greater' social status than being somewhere between middle and working class is to be. It is the latter position that actually constitutes the middle of the social scale.

The following table lists occupations and occupational groupings by self-assessed social class on a 1-4 scale, the higher the number, the higher the class. The mean is 2.47 with a standard deviation of .64:

OccupationClass
Doctors, veterinarians, dentists, and pharmacists3.15
Lawyers2.98
College/university lecturers and professors2.90
Architects and engineers2.90
Authors, writers, and journalists2.87
Religious practitioners2.83
Sculptors, painters, actors, and other artists2.81
Computing professionals2.81
Government officials2.77
Teachers2.76
Sales and finance workers2.73
Accountants2.71
Operations department managers2.68
Sales representatives2.67
Human resources workers2.67
Real estate agents and appraisers2.63
Government workers2.63
Nurses2.61
Policemen and firefighters2.58
Retail/wholesale managers2.58
Office department managers2.58
Mail carriers and sorters2.55
Bookkeepers2.55
Housekeepers2.51
Social workers2.50
Secretaries and other office clerks2.50
Military personnel2.49
Equipment technicians2.49
Retail salespeople2.49
Bank tellers2.47
Teaching assistants2.46
Receptionists2.45
Life sciences workers2.40
Hairdressers and beauticians2.40
Certified nurse assistants2.36
Childcare workers2.36
Medical assistants2.33
Cashiers2.31
Waitresses and bartenders2.29
Janitors2.27
Store stockers2.26
Machine operators2.26
Construction workers and carpenters2.25
Truck drivers2.24
Sewers and knitters2.23
Plumbers2.22
Building maintenance workers2.21
Welders2.20
Personal care workers2.20
Painters2.18
Domestic help2.18
Cooks2.17

With doctors and lawyers at the top, it passes the smell test!

Indeed, teaching is more of a middle class occupation than nursing is (evincing the fact that while class and income tend to move in the same direction, the correlation is certainly imperfect), but both professions are in the top half of the distribution. That's hardly surprising since both require college degrees and consequently are closed to most of the population.

Bank tellers are the most middling. Other Joe and Jane Americans include those in the military, techs, retail salespeople, and teaching assistants. Those sorts of jobs may strike readers here as distinctly 'prole', but we don't tend to associate with a representative sample of the public on a regular basis. I recall Charles Murray once quipping about how academics and intellectuals errantly tend to think of truck drivers as the bottom of the (white) social spectrum when in reality it descends a lot lower than that.

GSS variables used: CLASS, ISCO88. If interested in the specific codes used for each of the occupational categories, I'll gladly send the excel file--it's too tedious to list out here, though.

Saturday, October 20, 2012

Intelligence and fertility by class, over time

Channeling Charles MurrayRandall Parker comments on the increasing social stratification that has come to define the contemporary Western world:
This isn't the 1950s when people could expect to pair up with a husband or wife and get a factory job that put them at similar status level to a large portion of the total population. We've got a much wider spread of classes and far more cognitive sorting. The poor are dumber on average and the upper classes are smarter on average. The classes have less in common: less shared understanding, fewer shared values, fewer shared experiences with cultural products such as TV and radio shows.
On the one hand, inequality has been public enemy number one for multiple generations now. On the other hand, one major consequence of a shrinking world is that cognitive sorting keeps getting easier to do and is continually approaching ubiquity in practice.

I wondered what insights the GSS might offer. The survey has a question for which respondents are asked which of four social classes they feel they belong to--lower, working, middle, or upper. The following graph shows mean wordsum scores by self-identified class membership over time. The three variables have not been cross-referenced for every year the survey has been conducted (not sure why, as each has independently been included since its inception, but it is what it is), which is why the years displayed jump around as they do. To avoid issues of English language fluency, the foreign-born are excluded:


Steady as she goes. Of course, this doesn't necessarily speak to potential changes in material or cultural class differences over the last several decades per se, but the cognitive sorting by class isn't blatantly obvious, at least not by this measure.

And because detecting dysgenic trends is a hobby horse here, the mean number of children by class over time:


Sample sizes are smaller for the lower and upper classes (self-assessment rates split about 5%-45%-45%-5%) so their respective lines bounce around more, but the pattern over time is pretty consistent--higher class means somewhat lower (and later) fertility, and people across the social spectrum are having fewer children today than their parents had.

GSS variables used: BORN(1), YEAR, CLASS, WORDSUM, CHILDS

Saturday, January 14, 2012

Self-identified social class membership over time

In an essay adapted from the forthcoming Coming Apart:The State of White America, 1960–2010, Charles Murray writes:
Finally, there is the most lovable of exceptional American qualities: our tradition of insisting that we are part of the middle class, even if we aren’t, and of interacting with our fellow citizens as if we were all middle class.
Murray argues that this phenomenon is ceasing to exist, in what seems to be a natural outgrowth (via HBD chick) of the increasing cognitive stratification that characterizes the contemporary United States, something Murray and Herrnstein famously chronicled in The Bell Curve. Instead of each person viewing himself as being crowded halfway up the ladder alongside everyone else--or, better yet, together flipping the ladder on its side and taking seats next to one another on a long bench of equal height--many more find themselves at the top or bottom ends, the distance in between too wide for either end to see, let alone interact with, the other end.

Murray goes on to statistically detail a divergence between that top and bottom on a host of social indicators. I wondered if Murray's observations might also be detectable in the way that Americans self-identify themselves. The proceeding graph traces the percentages of whites aged 30-49 (to stick with the demographic Murray discusses) by the social class they see themselves belonging to from the early seventies to the present (click to the left of the image for greater resolution):


Overwhelming majorities of Americans think of themselves, in essentially equal numbers, as either working- or middle-class. Small minorities identify at the bottom of the heap or at the upper echelons, again in equal numbers, with a small divergence identifiable in the last few years, presumably due to the 'Great Recession'.

Of course, ideal behaviors and actual behaviors are rarely the same thing. Indeed, we see that on the whole, people have perceived themselves maintaining similar levels of social standing over the last four decades even as the criteria for evaluating said social standing tells a different story. Propositionalism alone isn't enough. It may be a necessary ingredient of American exceptionalism, but it isn't a sufficient one. As Francis Grund observed nearly two centuries ago:
No government could be established on the same principle as that of the United States, with a different code of morals. The American Constitution is remarkable for its simplicity; but it can only suffice a people habitually correct in their actions and would be utterly inadequate to the wants of a different nation.
GSS variables used: CLASS, RACE(1), AGE(30-49)

Wednesday, December 28, 2011

As I proudly stand up next to you?

Reading Jared Taylor's most recent book, White Identity, I wondered how the seemingly endless number of examples provided to illustrate how widespread the disdain for the United States as a European-descended country is among non-whites translated into opinions offered by a representative sampling of the US population. Taylor's tone is thoughtful and sober, yet the book's content--intentionally or not--surely inflames racialist passions in many who read it (myself included). To use an example that doesn't happen to involve whites, consider the following (p82):
[Last year] in Manhattan, police arrested a group of black teenagers who specialized in beating up Asian women in their fifties to seventies. The boys acted as lookouts; it was the girls who attacked.
But in a country of over 300 million and a world of over 7 billion, anecdotes demonstrating just how vile acts of human depravity can be are always going to be abundant enough to fill a book like Taylor's from cover to cover. Taylor's book is not meant to be a comprehensively objective look at race relations in the West, however, and to criticize him for failing to present something he neither attempted nor claimed to be presenting is stupid. Having maintained a data-focused blog for several years, I'm well aware of the fact that it's not cold numbers but hot stories that move people to action.

That said, this post doesn't attempt to break the mold. It's true to TAE's tagline. Before tying into questions Taylor raises, we'll go there. In 2004, the GSS asked respondents how proud they are to be Americans. The following table shows the percentages who answered "very proud" by partisan affiliation. In all cases, non-citizens are excluded:

Party ID
Proud
Republican
92.1%
Independent
78.1%
Democrat
73.6%

Okay, so when Rush Limbaugh says Democrats are "anti-American" he's hardly being precise. Give them due credit for at least knowing they are free! Still, the conventional assertion by those on the right that conservatives are more patriotic (which, by definition, means to love, support, and defend one's country) than liberals are is accurate.

The differences are more politically-based than they are class-based:

Class
Proud
Lower
86.2%
Working
79.7%
Middle
81.1%
Upper
84.7%

Race, as it so often does, matters at least as much as almost anything else, although it's hardly clear that Hispanics in the US take more pride in Reconquista efforts than they do in the country they are citizens of:

Race
Proud
White
83.2%
Black
74.1%
Hispanic
71.6%
Asian
56.2%

Parenthetically, the Asian sample includes just 38 people (the only grouping in any of the tables with fewer than 100 respondents), so it should at most be interpreted as being merely suggestive. Incidentally, White Identity does include an unsettling chapter entitled "Asian Consciousness" that disrobes to some extent the 'model minority' conception of our yellow cohabitants.

When it comes to taking pride in their adopted homeland, the foreign-born largely assimilate to native norms:

Ancestry
Proud
Native
81.3%
Foreign
77.5%

Even wider than the partisan pride divide are the results of the generational invitational:

Age
Proud
18-24
63.3%
25-34
73.6%
35-49
85.5%
50-64
84.5%
65+
90.9%

While I'm not ashamed of my ancestors--not those who came over from England four centuries ago nor those who came from Ireland and Germany after WWII--it's almost instinctive for millennials to be embarrassed by the thought of being asked whether or not we love our country (and not because of concerns like Mangan's, although those are the more relevant issues to me). For my grandfathers, the answer would've been an automatic, delivered without hesitation. In contemporary schools and in the media, the narrative has increasingly become one focused on the oppression and exploitation that are said to constitute not only America's past but also her present, a focus utterly devoid of historical context or comparative objectivity. This is not without consequence.

GSS variables used: RACECEN1(1)(2)(4-10)(15-16), PARTYID(0-1)(2-4)(5-6), CLASS, AGE, BORN, AMPROUD1(1-4)
ban nha mat pho ha noi bán nhà mặt phố hà nội