RSS
Facebook
Twitter

Showing posts with label Seeking happiness. Show all posts

Saturday, June 30, 2012

Which way to Happy Happy Village?

Oh, so you say all you want is to just be happy? By way of ordinary least squares, here are the multiple regression coefficients for nine variables that are, in the conventional wisdom, arguably putative predictors of happiness, with the obligatory qualifier that some component of sunniness, of yet undefined magnitude, is innate. For contemporary relevance and to avoid racial confounding, responses are from 2000 onward and only non-Hispanic whites are included. Asterisks indicate statistical significance at 95% confidence.

First, for men:

Age -- .27* (youth = happiness)
Marital status -- .24* (marriage = happiness)
Class -- .24* (higher status = happiness)
Church attendance -- .11* (worship = happiness)
Education -- .06 (more education = happiness)
Political orientation -- .04 (conservatism = happiness)
Children -- .04 (procreation = happiness)
Number of female partners -- .00 (no relationship at all)
IQ (wordsum) -- .00 (no relationship at all)

The parenthetical stuff is there to clarify which direction the correlation runs in and shouldn't be interpreted as anything close to an absolute statement on causation.

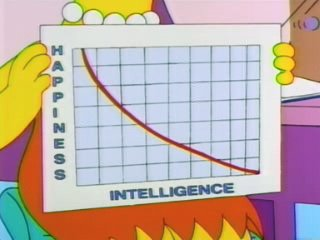
Being young, married, blue-blooded, and active in church are predictors of higher levels of self-reported happiness (I bet Mitt Romney is and has always been a really happy guy). Lisa didn't quite get it right with her graph showing a vigorous inverse correlation between happiness and intelligence, but what one focuses his cognitive horsepower on probably matters more than the number of stallions he has in the reigns.

This more-or-less meshes with the Game perspective--youthfulness and high socio-economic status are definite pluses, and marriage, while scorned as an emasculating deathtrap, does indicate some level of attraction to other women, which can potentially be used to a philander's advantage. While notches in the belt don't obviously bring happiness, they don't push it away, either.

And for women:

Marital status -- .26* (marriage = happiness)
Class -- .24* (higher status = happiness)
Education -- .23* (more education = happiness)
Age -- .18* (youth = happiness)
Church attendance -- .09* (worship = happiness)
Children -- .05 (procreation = happiness)
Political orientation -- (.03) (liberalism = happiness)
Number of male partners -- .03 (fewer partners = happiness)
IQ (wordsum) -- .00 (no relationship at all)
Not much in the way of substantive differences between the sexes, except that educational attainment is a relatively stronger predictor of happiness among women than it is among men (perhaps because social status is tied relatively more strongly to educational attainment among women while tied relatively more strongly to wealth among men), and youth is a stronger predictor of happiness among men than it is among women (or, more precisely, old age is a better predictor of unhappiness among men than it is among women).

GSS variables used: YEAR(2000-2010), SEX, RACECEN1(1), HAPPY(1)(3), WORDSUM, EDUC, MARITAL, CLASS, AGE, ATTEND, NUMMEN, NUMWOMEN, POLVIEWS, CHILDS

Saturday, February 18, 2012

Happiness and loneliness by age

In a post on the British government's push to keep people working into their seventies, Parapundit's Randall Parker excerpted remarks from a senior aide:

He told delegates at the Stockholm summit that more than half of those older than 75 in Britain described themselves as lonely “all or most of the time”.

“Work matters, particularly for older people, not just for money, but absolutely for social contact,” he said.

I wondered if there was much in the way of detectable differences in feelings of self-reported loneliness and happiness strictly by age. Obviously, a host of factors other than age influence how lonely and how happy people feel, but I was more curious as to whether or not there are differences as is, not after trying to control for everything like income and marital status. Simply, at what age(s) do levels of loneliness tend to be lowest and happiness greatest in the US?

The following table shows the percentage of respondents, by age range, who reported at their time of participation in the GSS that they had not felt lonely at all over the course of the previous week:

Age
Not lonely
18-24
48.6%
25-29
53.0%
30-34
51.6%
35-39
50.0%
40-44
55.0%
45-49
73.5%
50-54
56.7%
55-59
66.5%
60-64
72.0%
65-69
63.7%
70-79
61.0%
80-89
51.7%

Plotting loneliness and age exhibits a bit U-shape--it tends to be a little worse when people are younger and still finding their ways in the world, and when they're elderly, especially once they get into their late seventies and eighties and people around them really begin dying off. From the mid-forties to the mid-sixties looks to be our least lonely years, when people are established in the social institutions important to them.

The same table for happiness, but on a 3-point scale, inverted so that a higher value indicates greater happiness:

Age
Happiness
18-24
2.14
25-29
2.21
30-34
2.23
35-39
2.22
40-44
2.21
45-49
2.22
50-54
2.23
55-59
2.22
60-642.26
65-69
2.30
70-79
2.28
80-89
2.22

One standard deviation is 0.63 points, so the average difference from the least happy age to the most happy is one-quarter of one standard deviation. Not much here, but hey, I ran the numbers so why not share them?

GSS variables used: AGE, LONELY(0)(1-7), HAPPY

Saturday, January 21, 2012

Intelligence and depression

OneSTDV wonders:
There's some controversy over whether higher intelligence and depression correspond. From reading the "intellectual" sphere, generally defined as people who engage in self-analysis, one would surely conclude that such a correlation exists.
Arriving at this conclusion, unfortunately, demonstrates how problematic relying on a few anecdotal data points to arrive at generalized conceptions often is. On top of a prohibitively small sample size, selection bias is also at work here. Robert Lindsay summarizes the relevant scientific literature as follows:
Careful studies have shown that the high IQ basket case is a myth. Studies of very high IQ types have found that in general, as IQ rises, so does mental health. Why this is is not known.
The GSS shows that the least intelligent are the most likely to view life as being devoid of meaning. It's not difficult to imagine why this is the case, whether one employs a Maslow-esque hierarchy of needs where those of modest intelligence tend to be found near the base and the more intelligent closer to the top, or one simply realizes that those on the left end of the bell curve are generally incapable of thinking abstractly.

OneSTDV contrasts "cloudy skies" depression (which might be defined as feeling blue) from the sort of existential depression that a person is susceptible to if he dwells too much on the "relative scale of humanity in the context of our universe". We've seen evidence that argues against the assertion that existential depression and intelligence are correlated. Propitiously, the GSS also provides an item to gauge the more mundane "cloudy skies" depression. Since 2002, it has asked respondents how often they've experienced mental health problems (which include, but are not limited to, depression) over the last 30 day period. The averages (means), by intelligence grouping* (n = 2,537):

Intelligence
Blue days
Real Dumbs
3.7
Pretty Dumbs
3.7
Normals
4.1
Pretty Smarts
3.4
Really Smarts
3.3

Not much variance in the averages here. About the only thing that might be suggested is that higher intelligence may provide a bit of resistance to melancholy.

GSS variables used: WORDSUM(0-3)(4-5)(6)(7-8)(9-10), MNTLHLTH, NIHILISM

* Respondents are broken up into five categories that come to roughly resemble a normal distribution; Really Smarts (wordsum score of 9-10, comprising 13% of the population), Pretty Smarts (7-8, 26%), Normals (6, 22%), Pretty Dumbs (4-5, 27%), and Real Dumbs (0-3, 12%)

Saturday, December 3, 2011

Who's the $#@!ing nihilist around here?!

From City Slickers to The Great Labowski and from The Purpose Driven Life to The Selfish Gene, the question of purpose in life is not just one for philosophers, theologians, and psychologists--it has strong popular appeal as well.

It's perhaps easiest to define purpose by looking at its absence. The Inductivist recently reported on nihilism (as defined by agreeing with the statement that "life does not serve any purpose") and ethnicity, and that post served as the impetus to dig a little deeper into what the GSS reveals about nihilistic sentiment.

So, let's run the standard demographic gauntlet. The following tables display mean nihilism scores from the years 1998 and 2008, computed by taking participant responses to the 5-point scaled GSS item on perceived lack of purpose in life and inverting the averages for ease of reader comprehension. The higher the score, the more nihilistic the group is. One standard deviation is .76 points on the nihilism scale.

The first image that comes to my mind when conceptualizing a person who finds life devoid of meaning is of a person who is unhappy. But I attribute my own sense of contentment with what I see as purposes for my existence, so I have an obvious bias. The GSS also asks a question on self-described general happiness that was cross-referenced with the nihilism question:

Happiness
Nihilism
Very happy
1.44
Pretty happy
1.58
Not too happy
1.85

Biased as I am, my intuition appears to be accurate. People who feel life has no purpose are more likely to be miserable people than those who see purpose in their lives are.

The next stereotype that comes to mind is a person who is irreligious but vaguely "spiritual" and likes to claim to be into mysticism, etc. They're awash in the sea of life, without anything firm to hold onto. Conscious atheists tend to be adamant that God is unnecessary for meaning or morality in life, not that, having disabused themselves of the notion of God, meaning and morality have consequently disappeared for them as well. And those who firmly believe in the supernatural have had the purpose of existence spelled out explicitly for them:

Happiness
Nihilism
Atheist
1.60
Agnostic
1.76
Uncertain believer
1.69
Firm believer
1.50

Two for two. But the differences are more modest than I'd have guessed. Parenthetically, to give a little more purpose (heh) to blogging, I always write up impressions of the issues at hand before looking at the relevant data as a way of trying to maintain transparency and also because it's more fun (drilling down through the numbers can have a numbing effect if one isn't careful about how he approaches it).

Bruce Charlton, professor, former medical journal editor, and Christian apologist, colorfully contrasts non-believers with believers:
For the modern hedonic atheist nihilist - to look at the Universe is to feel insignificance, despair, meaninglessness...

But the uncorrupted man sees the heavens as the work of God, is overwhelmed by gratitude, delight, amazement - is moved to praise and worship.
To state with certainty that God exists is still the most common response to the question regarding God's existence (at least in the US), with nearly two-thirds of GSS participants doing so. But acknowledging the big guy in the sky and trying to live one's life in accordance to his wishes are hardly the same thing. Let's look at belief in the supernatural from a different angle, by comparing those who are "moved to praise and worship" with those who are not:

Worship frequency
Nihilism
Weekly or more
1.45
More than once a month
1.59
At least once a year
1.55
Less than once a year
1.70

Each classification is exclusive, so the second should actually read "More than once a month but less than weekly or more", etc.

The differences are a bit more pronounced here, and trend in the expected direction, with those who make it a point to go to church regularly sensing more purpose in life than those who do not.

How about children? It's said that once you have them, your life changes forever. What's more important than the well being of one's own children, on both the emotional and biological levels?

# of kids
Nihilism
0
1.62
1
1.53
2-3
1.53
4+
1.66

Swing and a miss. The number of kids a person has doesn't appear to influence the amount of purpose in existence. I guess passing the hot potato around a few more times before getting burned out doesn't necessarily give the silly game any additional meaning.

How about that beautiful organ, the brain, that separates us from beasts in the field? Excepting the supernatural, what thing possesses capabilities for discovering purpose that outranks those of the human mind? SWPLs love being driven by the things they are passionate about, the things that give their lives meaning. If life is devoid of meaning, engaging in abstract thinking begins to seem pretty pointless (even in a world where everything is already pointless, and... never mind). Or, turning it around, the ability to think abstractly allows one to perceive (or more creatively construct?) purpose. The inability to do so makes it difficult to see beyond immediate impulses and the steps needed to satisfy them. Do unintelligent people see a reason for existence? I don't know, do dogs?

Intelligence*
Nihilism
Real Dumbs
2.34
Pretty Dumbs
1.63
Normals
1.39
Pretty Smarts
1.35
Really Smarts
1.44

The differences between those of middling to high intelligence and those at the left end of the bell curve are large, with averages that are more than a standard deviation apart. Some of the gap gets closed by those of modest but limited intelligence. Intelligence, more than anything else, appears to influence whether or not a person feels that life has no meaning.

I may be reading too much into marginal differences, but perhaps those at the right end of the bell curve have some tendency to fully grasp their seeming insignificance in the larger universe and hence minimize what otherwise is seen to give their lives purpose.

Maybe it's better that the least intelligent amongst perceive the least purpose in existence. When they opt out of the conventional, established methods of discovering meaning in their lives through religion or professional success, they are liable to create harrowing identities like the ICP-inspired juggalo 'movement'.

More practically, influential people with prestigious careers are in positions to make decisions and engage in behavior for which the magnitude of consequences is much greater than people in the underclass are, and both groups are aware of as much, at least to some extent. Well, maybe greater meaning in one's own personal actions relative to other people translates into the perception of greater meaning in life more generally:

Class
Nihilism
Lower
1.78
Working
1.58
Middle
1.54
Upper
1.43

Makes sense to me.

Liberals want to turn Western Civilization on its head, conservatives want to bring Calvinism back into vogue, and wishy-washy moderates don't know what they want! As noted earlier, those who don't know what they believe in or what they want don't know what Fate wants for them, either:

Political orientation
Nihilism
Liberal
1.60
Moderate
1.61
Conservative
1.50

Another miss. Maybe politics just don't matter that much in the grand scheme of things.

Inductivist found that those of Mexican ancestry tended to be the most nihilistic of any ethnic group in the US. As the bulk of Hispanics in the US are of Mexican descent, we'd expect non-Hispanics of various races to be less nihilistic than Hispanics are:

Race
Nihilism
White
1.53
Black
1.55
Hispanic
2.02
Asian
1.80

Two-thirds of a standard deviation between the US' founding stock and its Great Society additions. Well, Manifest Destiny definitely insinuates purpose. The Great Cultural Mosaic or whatever the multicult mess will end up being called, on the other hand, is its own end-game, without much definable purpose beyond celebrating itself. We're the ones we've been waiting for, and when we get here, then... (Do I hear crickets chirping?)

I suspect women are less nihilistic than men for a couple of reasons. One, from an evolutionary perspective males are more expendable than females are, so there is less instinct for men to see a purpose in it all. Hell, even if there is a purpose, a bunch of them had no part in serving it! Two, the conventional societal response to the question of whether or not life is meaningful is yes, of course it's meaningful, and women are less comfortable violating social norms than men are:

Sex
Nihilism
Men
1.64
Women
1.51

Small difference in the averages, but as predicted men are more nihilistic than women are.

It's comforting to think that over time, as wisdom accrues and experiences accumulate, I'll increasingly come to perceive meaning in life. That vaguely seems to be the case so far. Yet I'm not oblivious to what the decaying process that is aging can do to a person's spirit. Once a week I spend a few hours with the elderly, and it's obvious that more than a few of them are donning thin disguises with happier visages that appear to be more at ease with what's in the not-so-distant future than the faces underneath those disguises betray. Ashes to ashes, dust to dust. What's the point in that?

Age
Nihilism
18-29
1.70
30-44
1.49
45-64
1.55
65+
1.61

Looks like while we're young, we're still searching. As we settle into middle age, we come to terms with what we've found and accept it. Then, as the aches and pains creep up and the thrill of living recedes, backsliding begins.

In summation, happy, intelligent, middle-aged upper class white women who are found in the pews on Sundays (and sometimes Wednesdays) tend to see the most purpose in life. Young, dumb, pissed off underclass Hispanic guys who wouldn't be caught dead in a church unless it was to grab a handout see the least. Purpose is so passe! The future is nihilism!

* Respondents are broken up into five categories that come to roughly resemble a normal distribution; Really Smarts (wordsum score of 9-10, comprising 13% of the population), Pretty Smarts (7-8, 26%), Normals (6, 22%), Pretty Dumbs (4-5, 27%), and Real Dumbs (0-3, 12%)

GSS variables used: NIHILISM, HAPPY, WORDSUM, GOD(1)(2)(3-5)(6), ATTEND(0-1)(2-4)(5-6)(7-8), POLVIEWS(1-3)(4)(5-7), KIDS(0)(1)(2-3)(4-8), RACECEN1(1)(2)(4-10)(15-16), CLASS, SEX, AGE

Thursday, July 21, 2011

Happiness by occupation

As I've been on a happiness trip as of late, it seemed natural to look at happiness levels by occupation. The GSS uses the international standard classification of occupations (ISCO88) to record the occupations of respondents and routinely asks a three point question on self-assessed personal happiness. To facilitate comprehension, scores are inverted so that higher values indicate greater levels of happiness. To achieve some level of statistical rigor, only occupations with more than 35 respondents are included:

Occupation
Happiness
1. Clergyman
2.66
2. Actor
2.51
3. Architect
2.47
4. Firefighter
2.44
5. Police officer
2.40
6. Physician
2.39
7. Teacher
2.38
7. Economist
2.38
7. Real estate agent
2.38
10. Electrical engineer
2.37
10. College professor
2.37
12. Accountant
2.36
13. Sales representative
2.35
14. Dental hygienist
2.33
15. Civil engineer
2.31
15. Bricklayer
2.31
17. Computer systems analyst
2.30
17. Registered nurse
2.30
17. Insurance agent
2.30
17. Secretary
2.30
21. Attorney
2.29
21. Psychologist
2.29
21. Child care worker
2.29
24. Government official
2.28
24. Stockbroker
2.28
26. Social worker
2.27
26. Engineering technician
2.27
26. Bank teller
2.27
26. Receptionist
2.27
30. Bus driver
2.26
31. Author
2.25
31. Physical therapist
2.25
33. Maid
2.24
34. Computer programmer
2.23
34. Mechanical engineer
2.23
36. Mail carrier
2.22
36. Barber
2.22
36. Butcher
2.22
39. Stenographer
2.21
39. Electrician
2.21
41. Librarian
2.19
41. Retail salesman
2.19
41. Plumber
2.19
41. Tool-and-die maker
2.19
41. Taxi driver
2.19
41. Truck driver
2.19
47. Carpet and tile installer
2.17
47. Sheet metal worker
2.17
49. Artist (fine art)
2.16
49. Welder
2.16
51.Telephone operator
2.15
51. Waiter
2.15
51. Security guard
2.15
51. Painter
2.15
55. Licensed practical nurse
2.14
56. Aircraft mechanic
2.12
57. Forklift operator
2.09
58. Cashier
2.08
58. Automobile mechanic
2.08
60. Data entry clerk
2.07
61. Construction worker
1.98
62. Janitor
1.93

Once again, religiosity and happiness appear to go hand-in-hand. One standard deviation is .62 on the happiness scale, so clergymen claim to be a lot happier than the bulk of people in other occupations.

People doing professional work that requires more brain than brawn cluster near the top, while the most menial job doers settle at the bottom (sorry Office Space fans!). The blue collar occupations of policeman and firefighter are exceptions to this loose rule. To the extent that the amount of personal fulfillment found in one's job correlates with happiness, this doesn't seem surprising--these guys are making war on the forces that hurt innocent people. They aren't routinely referred to as heroes for nothing.

There also appears to be a positive relationship between how publicly esteemed members of an occupation are and how happy those people actually say they are--pastors, policemen, firefighters, actors, and doctors are all in the upper echelons, while stockbrokers, computer programmers, and lawyers fall somewhere in the middle of the pack, despite these middling occupations providing their practitioners with good working conditions and compensation.

Speaking of esteem, that janitors come in at rock bottom brings to mind Principal Skinner's contempt for the unglamorous work:
Principal Skinner (to Nelson): All right, Mr. Smartenheimer, that does it. First, you're going to give back everything you've stolen. Then, I'm sentencing you to one week of the lowest, most degrading work known to man - janitorial work.

Groundskeeper Willie: Ah, geez. I'm standing right here, sir.

Principal Skinner: Ah, yes. Uh ... Take a good look at him, Nelson, 'cause that's where you're headed.

GSS variables used: ISCO88, HAPPY

Thursday, September 2, 2010

AE muddles on

It's almost so stereotypical as to be beyond parody, but I've been hooking up with a girl over the last few weeks who constitutes my first interracial experience (no home base, though). She's black, 18, great body, but she's not relationship material for a host of reasons that I won't bore you with (and are pretty predictable anyway). I haven't been as straightforward about my lack of interest in anything commital as I think I should have been, but I've been frustrated over not being able to attract any interest from a gorgeous, Jesus-loving all-American 22 year-old former college cheerleader who lives in the house next to the one I spent my adolescence in (I babysat her a decade ago, but only recently got to know her after she returned to her parents' house upon graduation). Like a pretentious brat, I've justified screwing someone over since the world's screwing me over.

The last exchange I had with the black girl, before seeing her one more time and then cutting off follows. We've always done the typical 'black friends' back and forth, so it's not really as crass as it appears to be.

---

Chanara: Are we not talking anymore?

AE: What's this royal 'we'?

Chanara: What the fuck is your problem?

AE: 99 problems but I guess this bitch ain't one of them.

Chanara: You guess? Your [*shudder*] ass was pose to have me over a long time ago. We should just get a hotel room and call it a day

AE: I don't do prostitution. Don't mix me up with your customers.

Chanara: Dont make fun of me. You never told me when to come over

AE: YOU'RE wrong, I said you could get in line but YOU'RE too prude.

Chanara: What are you talkin about? You mad cause we havent fucked?

AE: I don't get mad, I just get on. Rolling stone gathers no moss.

Chanara: Ok your disappointed we didnt fuck. your the one thats always working

AE: YOU'RE. God, it's "you're", not "your".

Chanara: Your not going to tell me how to talk

AE: Fine, talking is not what I want to do with you ;)

Chanara: lol let get together soon

AE: Seriously?

Chanara: What

AE: Never mind, we'll let that one slide.

Chanara: What are you talkin about?

AE: Abuse of the English language.

Chanara: Ill show you abuse

AE: On the way :)

[A couple days later, after not responding to multiple texts]

Chanara: You better not be tryin to talk to another bitch because it wont be good

AE: Look, I told you not to wait for me. I think you've got the wrong idea. I really need to sleep now, it's late

Chanara: omg Fuck you. i cant believe this shit

[She's sent a few other texts since, but I've decided not to respond, at least for awhile. I genuinely feel bad about leading her on.]

---

I'm kind of a mess right now, if the post doesn't make that obvious enough. My first serious high school girlfriend, who got married three years ago, just had a baby. I'm not getting any younger. I'm doing the open book thing here for my own benefit, hoping maybe to tap into the wisdom of readers who've been around a bit longer, whatever their reactions might be. Stop aiming for the stars, secure and invest in something on a mountaintop, stop jacking around, and realize you're a few years from thirty and need to stop jacking around, perhaps?

Chanara:
Cheerleader:

Wednesday, April 14, 2010

Relative absolutism

Are you an absolutist or a relativist when it comes to defining contentment and happiness (or telos, if you prefer)? Is there one definitional formula, or are there countless possible combinations leading to the same answer?

I'd describe myself as a relative absolutist. That is, there is one specific optimal formula for realizing happiness for each person, but there as many exact formulas as there are people. Nature presumably matters a lot, and nurture plays a part, too. Gardening works for one guy while spelunking does it for another guy. But exploring caves can't work for the first guy just as cultivating cucumbers won't do it for the other one.

Basically, Curly was on the money.
ban nha mat pho ha noi bán nhà mặt phố hà nội