RSS
Facebook
Twitter

Showing posts with label Health. Show all posts

Saturday, September 14, 2013

Randall Parker points to a CNBC article focused on unfunded pension liabilities at the state level that is packed with quite a bit of data on the financial condition of the fifty. I've been after something like this for several years.

There are multiple ways to view the numbers, but probably the most broadly informative involves adding together current state debt and unfunded pension liabilities going forward and then looking at these on a per capita basis. That is, determine the dollars each resident of a state is putatively on the hook for at present to pay what the state currently owes and will expect to additionally owe beyond its projected funds on hand. Of course, debt can be defaulted on and promises reneged--realistically, that, in tandem with some combination of currency devaluation, is my best guess for how this unsustainable situation eventually resolves itself, with varying levels of disruption at varying times in the future.

The following table shows per capita debt-plus-future-obligations ("debt" going forward), with the financially healthiest states at the top of the list and the least solvent states at the bottom:

StatePerCap$
1. South Dakota513
2. Tennessee847
3. Idaho969
4. Nebraska1,046
5. North Carolina1,138
6. Texas1,514
7. Wyoming1,982
8. Wisconsin1,982
9. Iowa2,296
10. Florida2,320
11. Missouri2,426
12. Georgia2,436
13. Vermont2,688
14. Arkansas2,695
15. Indiana2,707
16. North Dakota2,726
17. Maine2,756
18. Utah2,785
19. Arizona2,939
20. Washington2,961
21. Oklahoma3,237
22. Delaware3,265
23. South Carolina3,487
24. Michigan3,535
25. New York3,548
26. Minnesota3,606
27. Alabama3,746
28. New Hampshire3,762
29. Virginia4,035
30. Montana4,042
31. West Virginia4,223
32. Pennsylvania4,284
33. Kansas4,402
34. Oregon4,611
35. Nevada4,801
36. Maryland4,864
37. Colorado4,996
38. Louisiana5,205
39. California5,650
40. Mississippi5,882
41. Rhode Island5,901
42. New Mexico6,554
43. Ohio7,025
44. Kentucky7,322
45. Massachusetts7,455
46. New Jersey8,480
47. Illinois9,056
48. Hawaii9,878
49. Connecticut10,776
50. Alaska12,363

A visualization of the data with figures is available here, and is reproduced without interaction below:


No blatant trends jump out. Sparsely populated, mostly white flyover states in close proximity of Canada tend to be in the best shape, with the major exception of Alaska. Thank goodness for that petroleum dividend--suspend payouts for a decade or so and the problem is solved!

Illinois, the nation's most demographically representative state, similarly serves as one of the states that comes closest to serving as a microcosm for the nation as a whole, though even it comes up well short. While Illinois' residents are looking at a little north of $9,000 in debt peonage per, these state-level obligations pale in comparison to the debts and empty promises of the federal government, for which debt alone is currently running over $50,000 per person.

The article opens by attributing Detroit's municipal bankruptcy to "underfunded retirement promises to public sector workers". Tautologically so, but no doubt haters have made attributions of their own that are hatefully racist and racially hateful. The correlation between a state's Ice People (non-Hispanic white + Asian) population percentage and its debt is an inverse .21. It runs in the direction haters expect it to run in, though it's a tepid relationship.

How about something to Sean Hannity's taste? The correlation between debt and Obama's share of the 2012 presidential vote is a more robust .39. Blue states really do tend to be less fiscally responsible than red states even though blue states generally have more human capital to work with.

Speaking of human capital, the inverse correlation between debt and estimated state IQ is a statistically insignificant .06. The relationship between median age and debt is more feeble still, at .03. It might be nice to think that the states that have the most time to formulate viable solutions before the bills start coming due en masse are the ones who need that time the most, but alas it isn't so.

In addition to having, on average, modestly less intelligent populations than blue states, red states also tend to be fatter. In light (heh) of the above, then, it comes as little surprise that debt and obesity inversely correlate at .23. In this case, it looks like it's possible to have your cake and eat it, too--those public service health campaigns in Connecticut aren't doing the nutmeg state's bottom line any good!

Parenthetically, as a supporter of full Puerto Rican independence, I can now point to the fact that the island's per capita debt, at $12,487, is higher than that of any state in the union. While Puerto Ricans may not be as affluent as Americans, they're even better at spending money they don't have than we are. Really, what do they need us for?

Monday, July 1, 2013

Youths will be youths

As an addendum to the previous post, I suspected an age skew. Younger guys who buy cheap cigars are more likely to use them as blunts than older men are. The percentages of men aged 18-25 and aged 26+ who buy cigars and are active marijuana users, again defined as having smoked weed sometime in the last year:

Cigar18-25yo26+yo
Black and Milds21.3%12.4%
Swishers17.2%7.4%

Even among 'youths', though, it's more the exception than the rule.

2011 National Survey on Drug Use and Health variables used: CGR30BR2(404, 423), IRSEX(1), CIG30MLN(2-3), MRDAYPYR, CATAGE(2)(3-4)

Saturday, June 29, 2013

Reporting on what Justitia would surely regard as a hopeless and deeply unethical persecution prosecution, Jack Cashill writes:
Of note, Curly walked into the store with a couple of bills visible in his hand, likely the bills Martin exited with. Curly took the bills to the counter and bought two cheap cigars, or “blunts” as they are known on the street. The Urban Dictionary defines a “blunt” as a “cigar hollowed out and filled with marijuana.” Its virtue is that it can be smoked in public “somewhat inconspicuously.”
I've known people who smoke cigars as they are, but from personal experience I get the sense that much--if not most--of the time, they are purchased to be hollowed and used to smoke weed. Fortunately, the 2011 National Survey on Drug Use and Health allows me to see beyond the information my own lying eyes provide to me. The percentages of cigar buyers whose most purchased cigar brand is Black and Mild and Swisher Sweet, respectively (these being by far the two most popular cigar brands in the US), who are active marijuana users (defined here as someone who has smoked weed in the last year):

CigarWeed
Black and Milds15.5%
Swishers12.3%

I might be able to hang on to the "much", but "most" has to go. A significant minority of cheap cigar buyers are doing so to facilitate their marijuana usage, but most of them merely appreciate the love of a man for a fine Pennsylvanian cigar.

Tangentially, it's my impression that if you're a man and you smoke 100s, there's a good chance you're gay, since 100s are for women (and also that you're a prole, since smoking is for proles). I suspect this tendency is ratcheted up ten-fold if you smoke 120s. Unfortunately, the survey doesn't inquire about sexual orientation or 120s, however, so we'll have to settle with just considering regulars (or kings) and 100s, by sex. The gender breakdown among Marlboro* smokers by cigarette size (rows, not columns, sum to 100%):


MaleFemale
Kings59.9%40.1%
100s43.3%56.7%

Survey variables used: CGR30BR2(404, 423), IRSEX, CIG30MLN(2-3), MRDAYPYR

* The survey only poses this question to respondents who smoke Marlboros. Because it is a relatively masculine brand, the true overall tendencies towards smoking and thus size prefrences are probably shifted towards women in both cases, but by presumably similar degrees. The takeaway here is that indeed women prefer longs more than men do. Beyond image, it's putatively because 100s last longer and are less intense, both of which are qualities more descriptive of female pleasure than they are of male pleasure [/innuendo].

Tuesday, June 18, 2013

The obese eat weight loss up

Obesity rates by state:


And google search indices for "weight loss" by the same:


The correlation between the two is a rigorous .77 (p = .00*), a remarkably strong relationship for such a measurement, and at the state level to boot.

Candy man tempting the thoughts of a sweet tooth tortured by weight loss--well, at least it's not for a lack of trying. Or a lack of expressing at least a passing internet interest, anyway. Or even an excess of intelligence. If nothing else, they have the Dream.

Advice gleaned from a longitudinal study with a sample size of one: Cut the carbs, especially sugars and anything wheat-based, then eat to satiation without counting calories, points, or gil. Lift heavy things, and not just with the chest and biceps--get everything involved. Everything. Drink lots of water and don't drink much of anything else. Get seven hours of sleep a night. Have sex three or four times a week (really, moderation is golden here).

* 5.01^-11, more precisely.

Tuesday, June 4, 2013

Turned red, blue, purple, so colorful indeed

Think about the worst illness you've ever experienced, the kind of infection that sees you prostrated helplessly in front of the porcelain throne after making seven consecutive offerings to it while you desperately--and unsuccessfully--try to sneak a breath in edgewise, followed by a miserable, aching eternity of darkness in which your thoughts are, almost by necessity, about nothing other than being rid of the curse. If such an existence was your life's sentence, would you have the stomach to go on? What if it were to last, without interruption, for a full month?

These sorts of questions come to my mind whenever I'm mulling over the issue of assisted suicide (and in those mercifully rare times that I contract something so fierce). In answer to the first question, I'm a weak-willed buddhist--all of life is suffering, but I don't want to grit my teeth and bear it--get me out of here! To the second question, though, I like to think I would, and no worse for the wear.

How about if it were to continue for a full year, though? It's not difficult for me to sympathize with those who'd like to dismount from the mortal coil rather than be racked continuously by it as the earth makes it all the way around the sun. Yet if the person in question was someone I cared deeply about, I'd be tempted to compel him to suffer through it even, if he had access to a legally sanctioned, painless, clinically administered suicide escape hatch.

As is the case with so many social issues, I'm a libertarian at a safe distance but more of a sanctity-of-lifer up close. Politically pro-choice, but forever disappointed in a close family member who had an abortion, that's my line of thinking--it's why I prefer sticking to the data over pontificating from a personal perspective.

Andrew Stuttaford isn't so demure. He celebrated a legislative victory for doctor-assisted suicide out of the northeast, curiously remarking:
Vermont may be a lefty sort of place, but occasionally it gets some things right.
I say "curiously" because in the US--Stuttaford's home for the last couple of decades--euthanasia is primarily championed by the left, not the right. The GSS has queried respondents for even longer than Andrew has been on this side of the Atlantic on whether or not they feel a person who has an "incurable disease" has the right to commit suicide. The question is dichotomous, and for contemporary relevance, responses are from 2000 onward. By political orientation, the percentages of people who feel such a person should be able to end his life:

OrientationCato%
Liberal73.7
Moderate62.3
Conservative44.6

Since we're on the topic, feelings towards pulling the plug, by age range:

AgeCato%
18-2960.6
30-4461.5
45-6463.0
65+48.2

One might think that as the prospect of irreversible, painful decline went from theoretically occurring sometime in a young stripling's distant future to suffocating a senescent creature in his bed at the retirement home, the willingness to allow someone to die with dignity would increase. Sounds plausible, but it's not quite the case. Life was cheap in the old republic and it became even cheaper during the imperium. Parallels might be drawn. Shifting from contemporary to historical relevance, the percentages of respondents who expressed comfort with suicide, by year (in defiance of Hegel, images in blogger have become more, not less, buggy over time--click on the image if its bleeding over into the sidebar is driving you to distraction):


When I came into this place, it was still a minority position. No longer, for better or worse.

GSS variables used: AGE, POLVIEWS(1-2)(3-5)(6-7), YEAR, SUICIDE1

Friday, May 24, 2013

The rhetorical approach to selling eugenics

... is not to emphasize positive over negative iterations of the idea, or even, as I've done in the past, to focus on the consequent egalitarianism that these approaches, if put into practice, will presumably foster. No matter how delicately broached and amenably angled, it's inevitably received as being too harshly comparative, too judgmental, and we simply can't have that! Arguing that this guy should have five kids while this guy shouldn't have any is socially and politically intolerable in the contemporary Western world, irrespective of the merits of such an argument.

It needs to be about individual choice and self-improvement. Forget pushing (to a broad audience, anyway) for one group to do more procreating and another to do less of it. In vitro fertilization has come a long way in the last five decades, and embryo selection has progressed from being all about viability to include avoidance of undesirable traits, the most conspicuous of which is Down syndrome. And the inclusion of putatively desirable traits is somewhere just around the corner. Eugenics need not be about telling the best to breed more and the worst to breed less, but instead marketing it as a game anyone can play. If everyone begins systematically making the most of what they have, we get a rising tide raising all boats outcome.

Since we're on the subject of selling the idea of eugenics for public consumption, Razib Khan recently pointed out the seemingly obvious point (which I nonetheless have never explicitly acknowledged until he spelled it out for me) that eugenics, rather than being a way for the patricians to further distance themselves from the plebes, is actually a means of moving towards that good old American ideal of everyone having an equal--or at least less significantly unequal--shot:
Steve [Hsu] has much to lose in a selfish zero sum sense because he’s already rather assured of intelligent offspring. He’s smart. His wife is smart. Standard quantitative genetics implies that even if they regress to the mean his offspring will be quite bright. There may not be much more juice to squeeze out of that genetic background. It may be very different for a couple with more average endowments. So sorry to turn this upside down, but personal eugenics may in fact be a boon for the ugly, stupid, and psychologically unstable, because it gives them a opportunity to close much of the gap with those who were lucky in the genetic lottery. Some of you may object to terms such as “ugly,” “stupid,” or “psychological unstable.” But people with these issues have to deal with them in their day to day. One can make all the platitudes one wants to make about “inner beauty,” but very few people live by this ideal.
Anyhow, these rhetorical considerations are probably going to become moot in the future. Prospective parents are going to take advantage of technologies that give their children an edge in life regardless of braying from opinion makers. Elites can crow all they want about the need for racial and socioeconomic integration in schools; couples are still going to do their damnedest to get their own kids into the iciest, most affluent schools they are able to.

There is already good deal of conceptual acceptance of eugenic practices on the individual level, especially on the political left. From 2004, the most recent year in which the dichotomous question was posed, the percentages of GSS respondents who say they'd have an abortion or want their partners to have one if a test revealed "the baby has a serious genetic defect", by political orientation (n = 2,451):

PoliticsYes abort
Liberal49.8%
Moderate36.0%
Conservative21.5%

Though the major media regularly treats eugenics as being under the aegis of the right, I suspect the subset of the right to which it actually applies is about as large as the population for which "secular right" is an accurate descriptor.

GSS variables used: GENEABRT, YEAR(2004), POLVIEWS(1-2)(3-5)(6-7)

Sunday, May 19, 2013

I recall a couple years back reading about the state of Florida's implementation of a plan requiring aspiring recipients of welfare cash assistance (TANF, specifically) to take and pass a drug test to become eligible for said benefits. If successful, the state reimburses the welfare recipients for the cost of the drug test. If they fail, benefits are withheld and the test-takers are on the hook for the cost of having it administered.

Media coverage insinuated that drug usage among welfare recipients was, contrary to Florida governor Rick Scott's claim that welfare recipients have higher rates of drug use than non-recipients do, quite low--perhaps lower than that of the broader population--as less than 3% of those who went ahead and had a test administered on themselves failed to pass it clean. The hole in this implication, of course, is that many of those who qualify for welfare but have recently used drugs aren't going to drop the cash to take a drug test they know they're going to fail. One could make the argument that the more surprising result is that 1 in 40 willingly paid to have a drug test administered on themselves for no reason. Maybe they thought the test would fail, or perhaps these are people on the bottom rungs of the societal ladder and are consequently not well known for high conscientiousness or foresight.

There's a little bankshot in Scott's plan, as it disincentivizes drug usage among the poor while simultaneously reducing the number of people who are eligible to receive benefits by putting another hurdle in their way.

Since then, I stumbled across the 2011 National Survey on Drug Use and Health, with free online access available through the SDA interface. Unfortunately, the closest the study gets to querying respondents on welfare recipiency is whether or not they (or their families, for minors) are eligible for Medicaid (20% of participants said they were, 80% said they were not--I suspect those potentially eligible but who've never actually used Medicaid are mostly unaware of their eligibility or unwilling to take advantage of it for whatever reason, so I'd guess we're doing more than just proxying for low income here), and that question can only be cross referenced with "have you ever used X?" inquiries, not "have you used X in the last month?" questions.

Thus the following attempt to get a feel for whether welfare recipients are more or less likely to use illicit drugs than non-recipients are is a pretty rough approximation, but we work with what we have. To give participants a chance to have used the various stuff if so inclined to do so, I excluded respondents under the age of 20.

The percentages who have ever smoked marijuana by whether they are eligible or ineligible for Medicaid:

Weed%Used
Eligible41.5
Ineligible44.9

Crack:

Crack%Used
Eligible36.7
Ineligible21.1

Cocaine (powdered):

Coke%Used
Eligible17.9
Ineligible16.2

Heroin:

Heroin%Used
Eligible3.7
Ineligible1.7

LSD:

LSD%Used
Eligible60.6
Ineligible65.6

Methamphetamine:

Meth%Used
Eligible61.8
Ineligible52.5

Negligible differences between those eligible for Medicaid and those ineligible when it comes to weed and powdered cocaine, higher rates of having used crack, heroin, and meth among the eligible, and higher rates among the ineligible when it comes to having ever tripped on acid.

Crack is a black drug and meth is a white trash drug. Powdered cocaine and heroin are a little, uh, classier, acid is for the college-aged children of the middle class and the affluent who are on existential missions to find themselves, and weed is something people from all walks of life have used sometime in their adolescent and early adult years.

Parenthetically, if I'm able to use the data at hand to validate some of the stereotypes I'm asserting in the body of a post, I better do so. The percentages of respondents, by race, who've ever smoked crack:

Race%Used
White20.0
Black51.0
Hispanic17.1
Asian28.0

And used meth:

Race%Used
White52.3
Black47.8
Hispanic55.9
Asian63.6

GSS variables used: NEWRACE2, AGE2(9-17), MJEVER, COCEVER (fag!), CRKEVER, HEREVER (...better), LSD, METHDES

* I realize the usage figures for meth and LSD strain credulity, apparently being more experimented with than even marijuana. I'm unsure of why this is the case, but I doubled-checked the figures and that's what the results show, so take the meth data with a grain of your favorite substance. It's probably still worth noting the disparity between those eligible and ineligible for Medicaid, though.

++Addition++Dan shows how wildly off the meth (and by extension LSD) numbers are. The LSD and meth questions are grouped in under larger categories for hallucinogens and amphetamines, respectively, so it's probably "if you have ever used a hallucinogen, have you used LSD?", etc. Consequently, the racial distribution for meth use likely only applies to those who've used amphetamines of some kind. I'm fairly confident about the figures for the other drugs, though.

Thursday, April 25, 2013

Hatefact of the day

According to the CDC and the US Census, foreign-born residents living in the US are over 9 times more likely to have tuberculosis as native-born Americans are. Exotic disease is an aspect of diversity we don't celebrate enough!

Saturday, April 6, 2013

Cali Shore

Steve highlighted a NYT article on the increasing acceptance of illegal immigration in the state of California over the last couple of decades. That acceptance was coerced of course, as Californians peaceably tried, through the democratic process, to halt the transformation of their state by supporting proposition 187 in 1994 only to have it subsequently ruled unconstitutional in federal court. Thus the transformation continued, the most conspicuous consequence being that the golden state--which voted for Bush 41 in 1988--has become a permanent Democratic stronghold, one in which no Republican presidential candidate would dream of wasting time campaigning in.

I wondered how else the state's profile had changed relative to the rest of the country over the same period of time, so I dug up data on three conventional quality-of-life measures: Obesity rates, NAEP scores, and poverty rates. Diversity being strength, presumably things should be getting better for California on these measures!

On the fat front, indeed they are (or more accurately, corpulence isn't increasingly as rapidly in California as it is in the rest of the country)--in 1991, California was tied for the 10th slimmest 'state' (including DC) out of the 48 for which there were data. By 2011, it had upped its rep count to 6th slimmest of the same 48. Middle class white flight might have something to do with this, as native Californians who've remained have better SWPL credentials than the ones who've left do. Whatever the reasons, Cali continues to be as health-conscious as ever.

When it comes to scholastic achievement, though, things don't look so swole. Among 8th graders taking the math section of the NAEP in 1990, California's kids came in tied for 29th of 38 states. By 2011, they just had the Deep South and DC between them and the bottom of the barrel, coming in tied for 34th of the same 38 states. Alabama's motto is still "Thank God for Mississippi", but that may well soon change to "Thank God for California".

Twenty years ago, California's economic situation mirrored that of the nation as a whole. The state ranked 27th of 51 in the percentage of its population that was impoverished (the lower the ranking, the higher the poverty rate). Today, it's 35th of 51.

Healthier, intellectually incurious, and poorer--yep, that seems to capture the nation's contemporary transitioning, from sea to shining sea.

Saturday, March 9, 2013

Self-assessed health by race, age, and sex

Despite the claims that low educational attainment among blacks relative to whites is in large part due to blacks feeling intellectually inferior to whites (known in the academic literature as "stereotype threat"), the data actually show blacks to be as confident in themselves--if not more so--than are whites (and other non-blacks).

I wondered how similar the story would be when it came to questions of health. Black athletic prowess is possibly the least 'controversial' HBD-related topic to broach in the US. On the other hand, contemporary life expectancy is lower for blacks than non-blacks, and black obesity rates are higher than white rates are.

The 2011 National Survey on Drug Use and Health asked respondents to self-assess their personal health. The following graph shows the percentages who described themselves as being in "excellent" or "very good" health, by race (white refers to non-Hispanic white, black to non-Hispanic black, etc):


The health problems afflicting Native Americans are fairly well known among the general public, and they are familiar among feather Indians as well, as the survey results illustrate. Hispanic laconic demurity notwithstanding and with a pinch of apparent hybrid vigor, it appears that self-assessments roughly approximate actual outcomes--ice people tend to enjoy better health than sun people do.

For stereotype validation that rests on more certain ground, consider self-assessed health by age range. Again, the percentages describing themselves as being in "excellent" or "very good" health:


Finally, there isn't much difference between Venus and Mars on this one. By sex:


NSDUH variables used: NEWRACE2(1)(2)(3)(4-5)(6)(7), HEALTH(1-2)(3-5), IRSEX(1)(2), AGED(1-7)(8-11)(12-13)

Monday, March 4, 2013

Menthol preference by race

Some follow up on the previous post looking at racial distributions of smokers of the top cigarette brands in the US. Firstly, a couple of commenters asserted that Parliaments are the SWPL brand of choice. Here's the breakdown:


Primarily white with a nice Asian showing and a correspondingly weak NAM share. Looks like we have a winner. Rescued pit bulls suffer secondhand smoke from Newports and then from Parliaments, poor creatures.

Secondly, Billy Bob noted the accusation that by disguising the harshness of cigarette smoke, menthol-flavored cigarettes encourage younger people to take up the vice who might otherwise not if their options were limited to non-menthol options. The FDA applied the same line of reasoning when it banned the sale of other flavored cigarettes in 2009.

Fortunately, the NSHDU survey asked participants whether they've primarily smoked menthols or non-menthols in the past month. Cross referencing these responses to the age ranges of said respondents allows us to look at the relationship of age and menthol preference among smokers. The following graph shows the percentages of smokers who primarily smoked menthols in the last month by age range (and specific age, to the extent the survey data allows for it to be reported). To avoid racial confounding, only non-Hispanic whites are considered:


Tough to argue with the claim that younger smokers are relatively more inclined towards menthols than older (and, by extension, more veteran) smokers are. There is some expected noise, especially among 12 and 13 year-olds, but the trend is clear. The question of whether or not young smokers who take up menthols would be willing to smoke non-menthols at the same age remains, but surely some portion of them would not be apt to do so. Seems plausible to presume that banning menthols would reduce smoking rates (obviously), but more importantly, would disproportionately reduce smoking rates among young people.

There is a racial component to the question of banning menthols, of course. Namely, blacks of all ages are far more likely to smoke menthols than non-blacks are. The following graph shows the menthol/non-menthol distribution of smokers by race:


The idea of banning menthols is akin to prosecuting crack cocaine more aggressively than powder cocaine, and that sets off all kinds of PC alarm bells.

National Survey on Health and Drug Use variables used: CIG30MEN, AGE2, CIG30BR2(120), NEWRACE2(1)(2)(3)(4-5)(6)(7)

Saturday, February 23, 2013

Journey into my head for a moment to take a gander at the cigarette brand stereotypes I hold.

To the extent that SWPLs still smoke cigarettes, they smoke Camels, especially Turkish blends. Blacks love menthol, and Newport is the premier menthol brand (Kool isn't the Pepsi to Newport's Coke, it's the 7 Up). Hispanics, especially the short, brown ones who know less English than you know Spanish, have an affinity for the gaucho/cowboy image--makes them feel a bit more at home, or at least better about being away from it. Pall Mall is the non-generic brand of choice for white trash. Doral is the more multicultural non-generic choice of the poor proles. Winston is a classier Marlboro.

Now let's put the tagline into action and validate these conceptions to the extent that they're worthy of validation. The following graphs show the racial breakdown of smokers of the top six most popular cigarette brands in the US as of 2011. Data comes from the National Survey on Health and Drug Use and the CDC:


Marlboro has the largest Hispanic share of the big brands. So far, so good.


Yeah, that one was easy. You really have to have your head in the sand or live a life in which you rarely come into contact with the lower rungs of society not to realize that Newports are as black a brand as are Air Jordans and Church's Chicken. Yes, Barack Obama purportedly used to smoke Marlboros, not Newports. That shouldn't come as a surprise (though I would've guessed he smoked Camels).


Difficult to tell from racial composition alone. It's not the whitest brand, but it is the least black brand, which is a fairly good indication that it's yuppie stuff.


So white. But these are the wrong kind of white people. They're apt to call these things "pell mells" or in some other way butcher the pronunciation of such a simple rhyming phrase.


Winston is the brand that most closely mirrors old stock America.


Okay, maybe Doral more closely mirrors old stock America than Winston does. Perhaps I need to claibrate a little--Winston is the classier Doral.

National Survey on Health and Drug Use variables used: CIG30BR2(104, 107, 115, 118, 119, 126), NEWRACE2(1)(2)(3)(4-5)(6)(7)

Tuesday, September 4, 2012

Calorie burning corpulence

Reading Razib in my hotel room in God's country over the long weekend moved me to check out the fitness room. Here she is:


Editorializing a bit, it's repetitive, low intensity equipment, exclusively. And it's typical. This stuff burns muscle and causes the body to store fat in the kangaroo pouch. Diet is the primary cause of the obesity 'epidemic', but this non-dietary prescription is about as helpful as the call for more education is when it comes to trying to equalize economic outcomes.

Parenthetically, I pack a weight vest and a medicine ball when travelling and go to work in the room. It's enough.

Monday, August 6, 2012

Amassing mass

Prior to last week, excepting routine dental cleanings I hadn't been a medical patient in any capacity for nearly a decade. I have full employer-provided health coverage I've never used and I'm pushing thirty now, though, so it seemed as good a time as any to schedule a physical.

Oh no! With a body mass index of over 27 (the commonly used statistic for assessing overweight and obesity rates in the US), I find out I'm overweight. Obesity isn't that far over the horizon. When I ran cross country in high school, my BMI was around 23. My body fat then was 13%. Today it's 9%. 

A healthy AE
AE on the way to the morgue
I realize it's hardly novel to criticize the BMI, and as someone who relies heavily on the GSS' wordsum vocabulary test as a proxy for IQ, I'm the last person who should criticize imperfect metrics. Still, it's worth keeping in mind that the trends over time in the US towards conspicuously building muscle mass and increases in obesity rates are correlated to some extent. Half Sigma has pointed out that Burt Reynolds used to cut it as an onscreen strongman. He obviously wouldn't today.

Sunday, June 10, 2012

White guys are the worst

A fun article that appeared on the classy site Jezebel (I'm not a regular reader--Tony Horton brought the piece to my attention) does a pretty good job (for an anecdote, anyway) of illustrating the demographic hipness hierarchy that exists in contemporary America. Ben Mandelker, apparently a pretty typical SWPL guy, who is a few months into the P90X workout program, ranks, countdown style, the supporting cast. Like other lists that ostensibly have nothing to do with ethnic, racial, or sexual characteristics, this one allows us to make observations about demographic characteristics that the person or people creating the list probably didn't have in mind when constructing it, at least not consciously.

I've reproduced his rankings in the proceeding table, but replaced names and editorializing with racial and sexual characteristics, as well as a few relevant parenthetical notes. I've inverted from worst-to-best to best-to-worst for ease of viewing:

From best ...
1. Black woman
2. Black man
3. White man* (!)
4. White man (physically handicapped)
5. White woman (bisexual... actually, "omnisexual")
6. White woman (foreign-born)
7. White woman (old)
8. Black man
9. White man 
10. Hispanic woman
11. Asian man
12. White man
13. White man
14. White woman
15. White woman
16. White man (foreign-born)
17. White man
18. White woman
19. White man
20. White man
21. White man
22. White woman
23. White man
... to worst

We know having black friends is hip, even if those friends were immersed in middle class values growing up and they end up living in mostly white neighborhoods (the three black characters' names are Pam, Adam, and Tony, not L'akisha, D'Brickshaw, and Terrance). The lowest ranking non-white is the Asian guy (the West's softest minority target) and he still comes in among the top half. Sexual deviancy and disability provide whites with some limited means for advancement.

In summation, the only black woman takes the gold. The two black guys average a 5 slot. The sole Hispanic gets a 10 slot and the only Asian an 11 slot (a spot also occupied by foreign-born whites). For white women, the mean is the 12 slot, and for white men it's the 14 slot.

Wait, am I describing a specific data set or the modern zeitgeist? Right, I could be doing either thing, hence the illustrative value of Mandelker's article.

* Daniel, who is clearly one cool cat, is my favorite member of the supporting cast, followed closely by Adam (#2) because of how hard he pushes me and Timmy (#20) because he reminds me most of myself.

Tuesday, February 28, 2012

One of my favorite rhetorical devices to use on those who cast moral aspersions on the actions of historical figures involves a thought experiment about the consumption of meat, or more precisely, eating animals slaughtered for the sole purpose of becoming our dinner. It doesn't seem inconceivable to me that in the future, the thought of engaging in such behavior comes to be seen as being as morally abhorrent as slavery seems to us today. Should they, and nearly everyone else they know, be at risk of being written off by posterity as perpetrators of turpitude for something that wasn't even controversial in the early 21st century society in which they lived?

That such a shift sounds somewhere between far-fetched and inconceivable to a contemporary audience, of course, is exactly the point, just as the abolition of slavery would've sounded to 2nd century Romans and their contemporaries or the idea of amnesty for the resisting residents of Jerusalem following the first crusade's successful siege of the city would've sounded to the crusaders and their contemporaries, including the saracens they put to the sword.

One reason I employ the animal eating device is because it's usually a leftist sympathetic to vegetarianism who is passing haughty judgment on people in the past, and I can't help but experience a little thrill from making people squirm. But it's plausibly grounded, too, I think, and I don't just mean because of the popularity of documentaries like Food, Inc. In vitro meat, presaged by Winston Churchill eighty years ago, could portend a future in which synthetic meats are grown by using a protein to cause muscle cells to grow into chunks of meat to such an extent that a single animal (or maybe a sacrificial Noah's ark's worth, for the sake of variety) could conceivably feed the world many times over.

See any glaring problems with this conversational approach? It's been pretty effective for me, but in real life most of the people I talk to are less knowledgeable and intelligent than I am, while in the virtual world, most people are more knowledgeable and intelligent than I am, so TAE is a great personal resource for soliciting feedback on this kind of thing!

Saturday, January 21, 2012

Intelligence and depression

OneSTDV wonders:
There's some controversy over whether higher intelligence and depression correspond. From reading the "intellectual" sphere, generally defined as people who engage in self-analysis, one would surely conclude that such a correlation exists.
Arriving at this conclusion, unfortunately, demonstrates how problematic relying on a few anecdotal data points to arrive at generalized conceptions often is. On top of a prohibitively small sample size, selection bias is also at work here. Robert Lindsay summarizes the relevant scientific literature as follows:
Careful studies have shown that the high IQ basket case is a myth. Studies of very high IQ types have found that in general, as IQ rises, so does mental health. Why this is is not known.
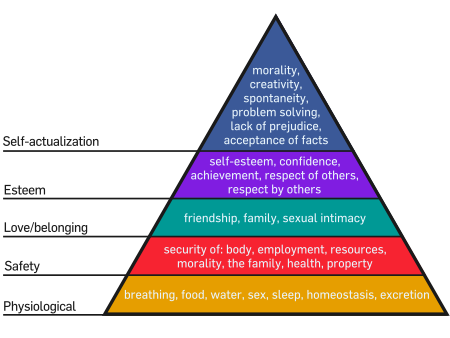
The GSS shows that the least intelligent are the most likely to view life as being devoid of meaning. It's not difficult to imagine why this is the case, whether one employs a Maslow-esque hierarchy of needs where those of modest intelligence tend to be found near the base and the more intelligent closer to the top, or one simply realizes that those on the left end of the bell curve are generally incapable of thinking abstractly.

OneSTDV contrasts "cloudy skies" depression (which might be defined as feeling blue) from the sort of existential depression that a person is susceptible to if he dwells too much on the "relative scale of humanity in the context of our universe". We've seen evidence that argues against the assertion that existential depression and intelligence are correlated. Propitiously, the GSS also provides an item to gauge the more mundane "cloudy skies" depression. Since 2002, it has asked respondents how often they've experienced mental health problems (which include, but are not limited to, depression) over the last 30 day period. The averages (means), by intelligence grouping* (n = 2,537):

Intelligence
Blue days
Real Dumbs
3.7
Pretty Dumbs
3.7
Normals
4.1
Pretty Smarts
3.4
Really Smarts
3.3

Not much variance in the averages here. About the only thing that might be suggested is that higher intelligence may provide a bit of resistance to melancholy.

GSS variables used: WORDSUM(0-3)(4-5)(6)(7-8)(9-10), MNTLHLTH, NIHILISM

* Respondents are broken up into five categories that come to roughly resemble a normal distribution; Really Smarts (wordsum score of 9-10, comprising 13% of the population), Pretty Smarts (7-8, 26%), Normals (6, 22%), Pretty Dumbs (4-5, 27%), and Real Dumbs (0-3, 12%)

Friday, January 6, 2012

Cardio contingencies

Santa brought me P90X2 for Christmas. I won't actually dive in until next week after I've made the necessary additions to my home gym, but it seems as relevant a time as any to pick a bone with those leveling criticism at cardio workouts as being something that should be avoided. In a post entitled "Why the P90X exercise program is overrated", Vin Miller writes:
Don’t Do the Plyometrics, Kenpo X, or Cardio X Workouts

When proper safety precautions are observed, plyometrics is a great way to improve performance and injury resistance. However, the P90X Plyometrics workout is more of a long calorie burning session than a true plyometrics workout. Along with Kenpo X and Cardio X, these workouts are very similar to aerobics, step, or spin bike classes which means that they’re relatively high in intensity and are a significant physiological burden that can easily wear down the body and require more time to recover from, especially when done on a regular basis.

It's not that Vin Miller's recommendation is necessarily incorrect, it's just that it's not universally applicable. Oddly, he earlier criticizes the program for focusing too much on glamor muscles and not enough on a "truly healthy and balanced lifestyle", yet it is anaerobic work, not aerobic work, that gets the most conspicuous aesthetic results.

If the goal is to build upper body muscle mass, intense cardio is potentially counterproductive, especially when done in long intervals and/or high frequencies. But it's crucial piece of overall conditioning for athletes, and not just for professionals. As a recreational athlete, pullups and pushups aren't going to do me as much good when I'm playing soccer or ultimate frisbee as endurance work will do. Body builders suck at most team sports like basketball and 7-on-7 because all that mass is heavy and demands a lot of oxygen when exerted.

During plyo, Tony Horton states that the workout really helps him step up his game on the court, and it is undoubtedly true--plyometrics makes one a better basketball player.

Vin Miller suggests as an alternative to intense cardio going on a brisk walk or an easy bike ride and getting one's heart rate up in the 55%-75% range. For general health, there probably aren't any negative consequences in getting out there and doing what my 55 year-old mother does each morning, but it's not going to do a thing to help an athlete (which I define here as anyone who pushes his physical capacities to their limits--in addition to playing sports, it also applies to those who figure skate, rock climb, etc). To realize real gains, an athlete needs to push into the 90% range.

Friday, December 9, 2011

It's my understanding that the media mass exhorting people to stick to this or that various difficult diet and exercise routine is incalculably large, and a google search confirms as much. I've never so much as glanced at it, let alone dived in, though, because for whatever reason--propitious or not--physical prowess has at least since high school been incorrigibly desirable to me. I've never smoked, drank, or used other illicit drugs, largely because of this. Yet running stairs or doing clap pushups are not mentally effortless activities for me by any stretch. A few tips from personal experience that are applicable (and hopefully helpful) to readers who want to improve quality of life through their outputs*:

- The first step is always the hardest of all. Not feeling sprite? Tell yourself you're just going to knock out ten minutes worth of work and then call it a day. I've done this forever and still do, and I suppose if I really did feel like throwing in the towel after a few minutes, I would. But I never have. Once I get the blood flowing, the lungs opened up, and let the adrenaline pumping, it's go-time.

- To facilitate this, dispense with the predetermined number of exercises and reps. This was difficult for me to do at first, but it makes finding fail a lot more realistic, and failing is how you get results. If you tell yourself you're going to do this progression of exercises and X number of reps for each one, tricking yourself with the ten minute trial won't work. As you're slugging through, you'll be apt to start thinking about how you're going to have to do 30 squat presses in half an hour and how fatigued you'll be then, so let's not push beyond 10 Y-presses now.

And some days are simply going to be better than others. Sometimes I'm able to get beyond 10 one-arm pushups per side, other days I'm collapsing at 6 or 7. If I obsessed over rep counting, I'd almost have to conclude that I was backsliding, which is a demotivating thought I need to avoid. I've broken the same rib three times playing football, and some days my right obliques are really tight with the consequence that my V-ups on that side are pathetic. That doesn't matter. What matters is that I do as many as I'm able to.

- Which segues nicely into an important phrase to remember: The mind always gives out before the body does. I say "remember", but it's actually something you don't want to think about while you're pumping, because if you rely on your mind to consciously tell you its thinking is flawed, well, that's a flawed strategy. Working out with others (even if they are on a screen) helps keep your mind from focusing on this and instead focuses it on surpassing (or at least keeping pace with) them, which you're a lot more capable of doing than your mind wants to tell you that you are!

If you're working out alone, have some sort of external stimulus to distract your mind from the exertions of your body. For cardio, I run stairs in a commercial stairwell I have access to, north of 200 flights per session. It's when I get my weekly Radio Derb and EconTalk podcasts in, or listen to an NFL game is my timing is right. Only once have I forgotten my iPod (and after that, I bought an AM/FM radio that sits in the car just in case), and decided to try to pull it off with nothing but the sound of my feet pounding and my lungs sucking. Frustrated, I finished earlier than usual and took multiple 30 second water breaks in between. I guess if you're going for mastery of mind over matter and want to override the signals your mind is receiving to let up through sheer force of will, go the Zen route. But if it's physical results you're after, don't engage the quit signals--distract your mind from receiving them in the first place.

* I'd convey what I've gleaned regarding eating what you want to be eating instead of what you want to eat, but the best I can come up with is don't have access to what you don't want to be eating (ie, don't buy it), and know that if you eat the right stuff, you are allowed to eat as much as you want (my daily calorie intake is around 4,000). Also, avoid calories in liquid form, because with a few exceptions, those calories are going to come almost exclusively in the form of sugar. Water (at least two gallons per day, in my case), a sugarfree energy drink or two (Rockstar is my personal favorite--and this is admittedly a personal indulgence, probably not something I should recommend), a cup of black coffee or tea, and low sodium V8 is all I do. Fruit juices, colas, beers--that's going to turn right into dough.

Saturday, November 19, 2011

More on the demographics of mental health

In the previous post, we looked at the likelihood to have received treatment for a mental health problem by political orientation based on GSS data. It turns out that self-described political liberals are twice as likely to have been treated for mental health issues as conservatives are, with moderates falling in between*. This spurred several intriguing comments that I'll turn to the GSS again to address.

Firstly, the inevitable racial issue. An anonymous commenter writes:
This generalization is too broad, since I'm sure Caucasian Liberals will have superb mental health compared to Caucasian Conservatives. Since there's studies that shows that those in higher Academia has the least stress and hence the best health.
It turns out he was being tongue-in-cheek, and whites are more prone to experience mental health issues than non-whites are. The percentages who have been treated for mental health problems, by race (n = 1,412):

Race
Treated
White
15.1%
Black
9.3%
Hispanic
6.8%
Asian
9.4%

As blacks are only slightly more likely to identify as liberal than they are as conservative, despite consistently voting Democratic by overwhelming margins, it's conceivable that race obfuscates the association between liberalism and mental health issues. In actuality, however, the relatively good mental health of non-whites attenuates political differences that are even more stark when only whites are considered (n = 1,033):

Whites only
Treated
Liberal
23.7%
Moderate
13.3%
Conservative
10.6%

While only 1 in 10 white conservatives have been treated for mental health problems, nearly one-quarter of white liberals have. I am not qualified to explain why this is the case, but perhaps God has something to say about it. In clearing up the confusion about his first comment, the anonymous commenter later writes:
Conservatives should be mentally healthier, because they tend to be more religious, hence making it easier for regulation of mental health.

Liberals worry so much that they actually care about people they don't even know.
Whether or not liberals have more mental issues to deal with because they want to put the weight of the world on their own shoulders, God's most ardent followers tend to come from the conservative ranks, and one of the rewards they receive in return is better mental health. To avoid racial confounding, only whites are included (n = 1,064):

Worship frequency
Treated
Weekly or more
11.0%
More than once a month
13.6%
At least once a year
16.4%
Less than once a year
17.5%

Each classification is exclusive, so the second should actually read "More than once a month but less than weekly or more", etc.

What about Jews? TAE is, loosely defined, part of the alternative right blogosphere, so the question has to be asked! Jews, after all, are as a group more leftist than white Democrats are. Again, God's hand is shown! Not just any god, but our God, an awesome God who reigns from heaven above (n = 1,405):

Religion
Treated
Protestant
11.7%
Catholic
10.7%
Jewish
17.4%
Other
21.0%
None
19.8%

Unfortunately, the GSS is understandably unable to track ethnic Jewishness among survey participants. Instead, we're looking at Judaism by way of self-described religious affiliation. As Jews are considerably more likely than other Americans to be irreligious, there is presumably a sizable contingent of ethnic Jews in the "none" category.

Another trait that requires attention is intelligence. Writes Ed Tom Kowalsky:
[There is a] need to control for IQ inasmuch as I suspect mental illness tracks with intelligence.
Disappointingly, the best GSS proxy for IQ, Wordsum score, is not cross-referenced with the mental health question so controlling for it is a difficult thing to do. Educational attainment is of course correlated with intelligence, but the relationship is far from perfect. Instead of moving out several degrees by using education to estimate wordsum performance to estimate IQ scores, let's just consider differences in rates of mental health issues by educational attainment, again among whites alone to avoid problems with racial confounding (n = 1,067):

Educational attainment
Treated
Less than high school
12.8%
High school graduate
11.9%
Some college
14.7%
Bachelor's degree
20.9%
Post-secondary education
19.7%

As was the case with worship attendance, each classification is exclusive, so the second should actually read "High school graduate but no college", etc.

While conservatives are, on average, slightly more intelligent than liberals are, white liberals have an edge over white conservatives, so the association between greater intelligence and more mental health problems might go a little way in explaining why liberals have poorer mental health than conservatives do (though for what my uninformed opinion is worth, I suspect differences in personality traits other than intelligence are far more determinative).

Silly girl contemplates the relationship between criminality, political orientation, and mental health:
I wonder whether folks who have ever been arrested or incarcerated are more likely to be liberal.

I would say that being anti social enough to end up in prison is a pretty good indicator of mental issues.
As Jokah points out, small sample size is a huge (heh) issue here, as the mental health question was only posed in one year of the survey, and the number of people who spend time in prison is in the middle single-digits range. This GSS well is dry.

For what it's worth, in Freedonomics (p182-184), John Lott--who it should be noted is clearly unsympathetic to the Democratic party--reviews multiple studies showing that to the extent that they express political preferences, felons tend to vote even more heavily Democratic than their demographic statistics (which are very Democratic) would predict.

Since we're running the conventional demographic gamut, let's look at marriage and children. To give respondents a chance to have tied the knot if their plans include as much, those under the age of 30 are excluded, while again only whites are considered (n = 926):

Marital status
Treated
Married12.8%
Unmarried
18.5%

And finally, kids. We're looking at the number white adults aged 30 and older have had (n = 927):

Offspring
Treated
015.2%
1
20.2%
2+
13.2%

So, mental health issues are most commonly experienced among well-educated, unmarried, irreligious white liberals who don't procreate (or do the SWPL thing and have one kid after both parents are firmly established in their professional careers). Mental health problems are progressive, baby!

GSS variables used: MHTRTSLF, RACECEN1(1)(2)(4-10)(15-16), MARITAL(1)(2-5), EDUC(0-11)(12)(13-15)(16-17)(18-20), CHILDS(0)(1)(2-8), POLVIEWS(1-3)(4)(5-7), ATTEND(0-1)(2-4)(5-6)(7-8), RELIGION

* As previously noted, the GSS item being utilized here asked respondents if they had ever received treatment for a mental health problem. That's not exactly the same as asking whether or not they had ever suffered from mental health issues, but it's pretty close.
ban nha mat pho ha noi bán nhà mặt phố hà nội