RSS
Facebook
Twitter

Showing posts with label US military. Show all posts

Tuesday, May 7, 2013

With the government-media complex highlighting sexual abuse in the US military as The Issue that now must be addressed straight, with gun control being a political loser, amnesty being undercut by the blatant immigration undertones of the Boston marathon bombing, and the taxing of online interstate sales having it's best chance of congressional approval if no one knows the critters are pushing it through--I thought I'd take a look at the primary source. With gays now being allowed to serve openly in the military, I also sensed an opportunity to cause some mischief.

The survey in question asks active duty personnel who have experienced "unwanted sexual contact" in the past year to focus on the most egregious incident when answering subsequent questions. Jumping out immediately is the fact that while the 2012 figure is higher than it was in 2010, results for 2006 are worse (as in a higher percentage of personnel reporting unwanted contact) than they were in either 2010 and 2012. This looks more like random year-to-year variation than an 'epidemic'. Personnel also report higher rates of unwanted sexual contact prior to becoming active duty military than they experienced after having enlisted. Lots of young, adventuresome singles in putatively stressful situations and there's less sexual harassment than there is in civilian life--when the percentage of people one comes into contact with who are potential sexual partners is often much lower than when on active duty--feels like a manufactured crisis to me.

Perhaps apprehensive that access to data broken down by sex of both offender and victim might give homophobes something to ream gays in the service with, data on offenders among female victims is reported but data on offenders for male victims is, inexplicably, not. The report simply reads "results for men are not reportable" (p32). Uh huh.

Fortunately, the data were broken out in 2010, and by employing a little algebra, we're able to glean from the latest report results from surveys conducted in previous years. The ratio of men-to-women who reported unwanted contact was nearly identical in both 2010 and 2012, with the latter showing an uptick of one-third more than 2010 for both men and women, so the following ratios almost certainly hold in 2012 even though I calculated them using data from 2010.

Things you're unlikely to see or hear reported from major media sources or pondered from the bully pulpit regarding sexual harassment among our active duty personnel:

- More men than women are on the receiving end of unwanted sexual contact--10,571 and 8,949 in 2010, respectively. Of course this is in absolute terms--women are still more likely to be victims of unwanted sexual contact than men are.

- According to the survey--conducted by the Defense Manpower Data Center (DMDC), operating under the Department of Defense--women are more than twice as likely as men are to perpetrate unwanted sexual contact, at least in situations in which the perpetrator(s) were of the same sex (a situation comprising 85% of all designated worst situations, the other 15% consisting of both men and women in a group making unwanted sexual contact with a victim). It strains credulity at first blush, but working from the tables provided on pages 34-36 and active duty personnel figures, we arrive at 12,326 total male offenders and 4,353 total female offenders* in an active duty service in which only about one-in-seven members are women. That translates to about 1 in 47 female personnel perpetrating unwanted sexual contact compared to just 1 in 95 male personnel doing so. Women are more likely to victimize and to be victimized than men are. Yet another reason that having them serve in the armed forces is such a swell idea.

- Relatedly, one-quarter (26%) of all unwanted sexual contact among active duty personnel involves women harrying men. One-half (52%) involves men getting after women, less than 1% consists of women sexually harassing other women, and the remaining cases (22%) involve men engaging in unwanted sexual contact with other men. I don't want my son's scout leader to be a gay guy or a woman. Heterosexual, please and thanks.

- Parenthetically, even if offending women in the military had a predilection for other female targets for their advances, it wouldn't be widely reported on. However, they don't. Offending women are more than eight times as likely to go after men as they are to go after women.

Beyond causing skepticism about the way the military goes about tracking sexual harassment, there are some potential story lines to go with these results--active duty women have clits as big as your di especially low digit ratios and the corresponding libidos to match, while men aren't that into these GI Janes. At least not for being red-blooded, mostly healthy trained killers, anyway.

Even less appealing, the number of active duty men who annually experience unwanted (homo)sexual contact from other men is in the high thousands (extrapolated to 6,307 in 2010, or around 8,500 in 2012). Yes, in our hypersensitive age, some non-trivial amount of identified unwanted contact--across all four offender-victim gender mixes--is innocuous badgering or having fun at someone else's expense, but still, like the priest abuse scandals that have 'rocked' the Catholic Church, there's a very real and very much downplayed homosexual element in play here.

* In reality, some of these offenders surely offended on more than one occasion and offenders may be individuals or members of an offending group, but the victims were not asked to identify the offenders by name, so for sake of clarity and consistency, I'm counting each offender as a separate individual. Consequently, these are lower-bound estimates of reported offender rates by sex.
Wednesday, January 30, 2013

Arie Peliger is a charlatan

Out of our most renowned, prestigious military academy's Combating Terrorism Center comes a report entitled "Challengers from the Sidelines: Understanding America's Violent Far-Right". At nearly 150 pages, it was difficult enough to hastily skim through, let alone read it from top to bottom. Sample sentence: "The far right has become more vibrant and more ideologically and structurally diverse than ever before." (Wait, is that a good thing?)

I'd like, however, to highlight the jaw-dropping statistical analysis the distinguished author, one Arie Perliger, offers. Jumping to page 96, we're presented with a table ranking states by the number of "far-right attacks" that have occurred in each over the last two decades. Subsequent correlations are then reported. The four variables for which the relationship with the number of attacks in a state are the strongest are Jewish population size (r = .900), state population size (r = .888), Hispanic population size (r = .849), and African American population size (r = .598). By "size", Perliger is simply referring to population and is thus not talking about attacks per capita. The reason California has suffered so many more attacks than Wyoming has  suffered (782 versus 6) is because California has so many more people--Jews, blacks, and Hispanics among them--than Wyoming has! I'm not making this up. Take a look for yourself.

Employing this 'methodology' (that would embarrass a freshman in the second week of Statistics 101), Perliger notes that "the birthplace of groups such as the KKK ... is no longer that natural habitat of the far right. ... The two states at the top of the list are California and New York, which are considered liberal--or blue--in terms of their ideological and political orientation. ... It can be determined that during the last twenty years the violence has shifted from the center/South to the coasts and the North (with the exception of Texas)."

To legitimately talk about a shift over time, Perliger would need to include a dataset from the past to compare to the present, which he doesn't do. That is parenthetical to the fatal flaw underlying his analysis, though. He is essentially putting together a ranking of states by population size, using it as a proxy for far-right violence, and then cobbling together something of a historical narrative about geographic shifts and trends in said far-right violence over time. By Perliger's thinking, if North Dakota and South Dakota combined into a single state, the new state, Greater Dakota, would be twice as susceptible to far-right violence as either state was before the merger! Mind boggling.

Perliger subsequently describes the use of "two-stage hierarchical regression analysis" which is "intended for controlling both state population size and density". I'm not familiar with what exactly that means, but whatever "controlling" entails, it doesn't appear to have much to do with controlling for variables. The correlations between violent attacks and black and Jewish total populations remained robust (.47 and .69, respectively), but for black and Jewish population proportions, the correlations were much weaker (.16 and .11). The relationship with the size of a state's Hispanic population and proportion apparently disappears entirely. From this, Perliger determines that "anti-Semitic and anti-African American sentiments and narratives are still emphasized and dominant ... hence there is a delay in the identification of the Hispanic minority as a threat by far-right groups."

Doing a little legwork with Perliger's data, the positive correlation between a state's hate rate and its total population is a moderate .33 (p = .02). While it's notable that such a relationship exists at all, it renders the commentary Perliger offers meaningless. Here's a state ranking of the annual rate of "far right attacks" per 100,000 people over the period covered:

StateRate
1. District of Columbia.303
2. Oregon.141
3. Maine.115
4. New York.110
5. Vermont.104
6. Massachusetts.104
7. New Hampshire.096
8. Washington.092
9. California.090
10. Idaho.088
11. Montana.087
12. Connecticut.084
13. Maryland.073
14. New Jersey.068
15. Rhode Island.066
16. Nevada.065
17. Iowa.064
18. Arizona.062
19. Delaware.062
20. Louisiana.062
21. New Mexico.061
22. Wisconsin.060
23. Illinois.058
24. Colorado.058
25. Florida.056
26. Pennsylvania.054
27. Minnesota.051
28. North Dakota.051
29. Indiana.051
30. West Virginia.049
31. Missouri.048
32. Alaska.048
33. South Dakota.047
34. Wyoming.046
35. Nebraska.045
36. Kentucky.041
37. Tennessee.040
38. South Carolina.040
39. Arkansas.038
40. North Carolina.038
41. Virginia.038
42. Kansas.035
43. Oklahoma.034
44. Texas.031
45. Michigan.031
46. Mississippi.029
47. Alabama.029
48. Georgia.028
49. Ohio.027
50. Hawaii.009
51. Utah.005

For comparative purposes, the national violent crime rate per 100,000 people in 2011 was 386.3. DC--home to so many militia types, as is as well-known as it is well established!--has highest far-right hate rate in the country. That alarmingly high rate is 1/1,277th of the national violent crime rate. Mercifully, the national hate rate is only 1/6,895th of the national violent crime rate. Yes, one of America's most pressing problems is indeed its violent, far-right extremists!

This is all really just a distraction, which I suppose is the point, much like designated "hate" crimes in general are (similarly to what is presented in the preceding table, DC has the second highest hate crime rate in the country, while Mississippi has the lowest--the correlation between Perliger's far-right hate rate and hate crime rates at the state level is a statistically significant .43, and with the South Dakota outlier removed, it jumps to .56). But the fact that tripe like this is being commissioned at the highest reaches of the nation's military establishment strikes me as almost indisputable evidence that we are doomed.

Thanks to an email from a reader who prefers to remain anonymous for pointing out James Bowery pointing out Perliger's report. The reader suggests those scandalized by this shoddy work write to the current commandment of cadets to express their displeasure:

Attn: Brig. Gen'l. Richard Clark
W. Pt Mil. Academy
606 Thayer Road
W Pt., NY 10996

Sunday, March 11, 2012

++Addition++Steve Sailer comments.

---

Steve Sailer comments on an article in YNet News about how "Israeli youth" (defined as those under the age of 30) are shifting politically to the right, specifically in their desire to join IDF combat units:
Although much of this is driven by the huge, subsidized fertility of the ultra-Orthodox in Israel, I suspect it reflects global trends, which in other countries tend to be masked by growing demographic diversity.
The GSS allows us to check the racial composition issue, but not mate it. Until the year 2000, the survey only broke racial classifications into three categories (white, black, other), so "white" includes Hispanics who considered themselves white rather than choosing the flattering "other" category. The following table shows the average conservatism score (on a 7 point scale, with 1 being "extremely liberal" and 7 being "extremely conservative") of whites aged 18-29 by half decade:

PeriodConScore
Late 70s3.63
Early 80s3.93
Late 80s4.01
Early 90s4.03
Late 90s3.93
Early 00s3.94
Late 00s3.98

From the eighties onward, it's pretty much been steady as she goes for the youth cohort, with the median settling almost exactly at the moderate (4) position.

However, there are a lot of things tied up in the labels "liberal" and "conservative" in the US that don't necessarily fit neatly into the question of whether or not an increase in authoritarianism has occurred among young people. The following table shows the percentages of whites (as previously defined) aged 18-29 who expressed "a great deal of confidence" in the US military, again by half decade:

PeriodConfident
Late 70s35.3%
Early 80s29.1%
Late 80s37.6%
Early 90s50.8%
Late 90s42.9%
Early 00s54.6%
Late 00s57.0%

Over the last decade, despite the dragged out wars in Iraq and Afghanistan, high levels of confidence in the US military among teenagers and young adults has been the norm, a noticeable departure from decades past.

While it's necessary to point out that confidence in the military has risen among all respondents over the same period of time, the rise among the young has been steeper. In the seventies and into the eighties, confidence in the military was lower among young whites than it was among the population as a whole, but by the nineties this had clearly reversed, with young whites expressing greater confidence in the military than the rest of the population does, and it has remained that way ever since.

Steve's insight isn't just domestic, though. The WVS potentially offers some insight into the question at the international level as well. I'll tap it next in an attempt to keep up with his ambitious mind.

GSS variables used: CONARMY(1)(2-3), AGE(18-29), RACE(1), POLVIEWS, YEAR(1974-1979)(1980-1984)(1985-1989)(1990-1994)(1995-1999)(2000-2004)(2005-2010)

Saturday, February 4, 2012

Ron Paul's thick blue line

The fact that Ron Paul blows the rest of the GOP presidential field out of the water when it comes to campaign contributions from military personnel is one that the Republican establishment can't profitably address. This isn't 1975. In 2012, US military personnel are among the most respected and honored people in the country. Consequently, asserting that the soldiers making the contributions are "nutty" or "disgusting" as they do Ron Paul isn't viable.

So it ends up being discussed on leftist networks like MSNBC more than it does on neocon organs like Fox News or in the WSJ, where ignoring it is the favored tactic. The working assumption among those who do confront it is that those who are on the ground actually doing the legwork for the nation-building efforts that define contemporary US foreign policy are the most strongly opposed to them. It serves as a pretty powerful endorsement of Paul's views.

But occupations aside, Paul's civilian base of support--conservative- and libertarian-leaning young men--is demographically similar to that of active US military personnel. So it's conceivable that this overlap, more than any specific affinity for Paul's non-interventionist foreign policy, explains his popularity among American soldiers.

The country's police forces are comprised of men and women cut from a similar cloth as its military personnel are, but in their day-to-day lives, police officers are presumably a lot more concerned about domestic policy issues and correspondingly less focused on foreign policy than their military brothers are.

Following this line of reasoning, I went to the FEC's website and downloaded the donor listing for all individuals who listed "police" as their employer or occupation through the end of 2011, and then backed out MPs from those listings. The proceeding table ranks all 2012 (current and former) presidential aspirants who have received campaign donations from those in police forces across the country by the amount of money each has taken in:

Candidate
$ received
1. Barack Obama
$26,836
2. Ron Paul
$10,896
3. Newt Gingrich
$3,760
4. Rick Perry
$3,120
5. Herman Cain
$3,067
6. Michelle Bachmann
$2,925
7. Mitt Romney
$2,137
8. Rick Santorum
$1,830
9. Tim Pawlenty
$250
10. Charles 'Buddy' Roemer
$165

In contrast to military money, nearly two-thirds of which flows to the GOP candidates, police money is almost evenly split among Republicans and Democrats (Obama). Paul's police advantage over the rest of the GOP field is not as gargantuan as his $6-to-$1 military advantage is, but he still beats the next highest Republican recipient by a $3-to-$1 margin.

To the extent, then, that this crude attempt to tease out how much of Paul's support among the military is due to his non-interventionist foreign policy and how much is due to the general appeal of a less intrusive, less bureaucratic, and less powerful federal government to right-leaning young guys full of testosterone is useful, it suggests the answer resides somewhere in between.

Tuesday, January 17, 2012

Reading Mangan's recent post contrasting the top sources of campaign contributions for the Romney and Paul presidential campaigns, I was surprised to find that the Texas congressman's three largest boosters are the Army, Air Force, and Navy. As Dennis points out, the lists compiled by OpenSecrets.org are comprised of donations from employees, family members, and organizations' political action committees, not from the actual organizations themselves.

Ron Paul is described as the "isolationist" (an absurdly inaccurate term to use in describing a vociferous free trade supporter such as Paul) candidate who wants to reduce the size of the US military's global footprint and substantially cut federal spending on defense. Pundits of the mainstream Republican establishment, who must now bite their tongues when they talk about Paul upon the realization that without Paul's supporters a GOP victory in November is virtually unattainable, have in the past expressed no reservations in labeling him an "anti-American". It's noteworthy, then, that those who actual serve in the US military appear to be among his most ardent supporters.

Mangan's post, however, reveals that Romney's tenth largest contributor has donated nearly five times as much as Paul's largest contributor has. So maybe the military branches are just further down Romney's list but still give more to Mitt and the other candidates than they do to Paul.

To find out whether or not that's the case, I went to the FEC's website and downloaded the entire donor listings for all individuals who listed "Army", "Navy", "Marines", or "Air Force" as their employer or occupation through the end of November 2011 (the latest figures available). The following table ranks all 2012 presidential (current and former) aspirants who have received campaign contributions from members of the US military by the amount of money each has received:

Presidential candidate
$ received
1. Ron Paul
$80,500
2. Barack Obama
$71,492
3. Mitt Romney
$12,700
4. Rick Perry
$7,575
5. Herman Cain
$7,318
6. Michelle Bachmann
$7,157
7. Newt Gingrich
$1,375
8. John Huntsman
$1,250
9. Gary Johnson
$750
9. Rick Santorum
$750
11. Charles 'Buddy' Roemer
$735
12. Thaddeus McCotter
$250
13. Tim Pawlenty
$250

Paul has garnered twice as much in donations for his presidential campaign from military personnel as the rest of the Republican field combined. Even president Obama, who owns the Democratic ticket, comes in below him.

I'd love to hear how Rush Limbaugh or Sean Hannity would react if questioned about why we should ignore what the "troops on the ground" are saying about the direction of our foreign policy and what needs to be done to change it. Of course we'll hear instead about the need to rally behind someone who supports the military and is strong on defense without a word on how those in the military actually feel about him.

Wednesday, July 13, 2011

There are those on the right who, attuned to the (liberal) zeitgeist, attempt to bring NAMs into their political ranks by emphasizing the putative social conservatism of blacks and Hispanics. Rick Santorum recently illustrated this, and the late Richard Nadler epitomized it.

As the US becomes increasingly multiracial and multicultural, our democratic system will increasingly turn into a spoils system, where votes are determined by the demographic characteristics of the candidates in question, who, once elected, will use their power to redistribute wealth away from out-group members to the in-group members who elected them. Even at the federal level, where this is less of an issue than it is at more local levels of government, it is certainly detectable.

While that is related to this post's purpose, the focus should be on the data. The following table shows the percentages of SWPLS (liberal and very liberal whites), white conservatives (conservative and very conservative whites), and NAMs (blacks and Hispanics) who agree with a host of political and social statements. The 20 items are broken up into four categories; those in which SWPLs and NAMs are on the same page, those in which NAMs fall midway between SWPLs and white conservatives, those in which whites of all political persuasions are lined up against NAMs, and those in which white conservatives and NAMs are aligned against SWPLs. For contemporary relevancy, all responses are from 2000 onward:

SWPLs and NAMs agree
SWPLs
WhtCons
NAMs
The death penalty should be given to those who commit murder
50.4
84.8
48.2
Pornography should be made illegal
19.8
52.2
33.1
Expresses a great deal of confidence in the US military
36.3
67.8
42.9
Favors increases nuclear power generation in the US
66.4
86.6
50.0
The government should spend more on health care
85.5
59.5
87.7
Immigration into the US should be increased
14.9
6.7
11.9
The government should raise taxes to reduce income inequality
67.5
24.0
55.6
NAMs fall in between SWPLs and white conservatives


The government should spend more to protect the environment
79.7
26.6
55.9
The government should spend more on the military
15.2
55.7
38.4
The government should spend more on culture and the arts
48.1
6.2
31.0
Background checks should be required for gun ownership
87.0
70.5
79.9
Environmental threats are exaggerated
14.9
67.5
32.5
Whites band together against NAMs


Special preferences should be given to minorities in hiring decisions
22.8
6.1
37.9
The government should spend more on unemployment benefits
34.3
20.1
54.5
White conservatives and NAMs agree


A woman should be able to have an abortion for any reason
69.7
21.8
35.3
Marijuana should be legalized
66.4
22.6
31.7
Same sex marriage should be allowed
81.5
14.5
28.7
Prayer should be permissible in public schools
35.3
68.9
68.2
It is okay to spank a child for disciplinary purposes
52.3
81.0
77.4
Terminal patients should be allowed to die if they choose to do so
86.3
50.4
53.4

Even though white conservatives and NAMs are more closely aligned with one another than either is with SWPLs on multiple social issues, pocketbook concerns trump moral values, especially among those who are not affluent, and of course NAMs disproportionately are not. SWPLs want to take from whites and give to NAMs to achieve social justice and NAMs want to take from whites and give to themselves to realize a higher material standard of living. Even on issues that are not of great interest to NAMs, like the arts (a liberal cause) and the military (a conservative cause), NAMs tend to favor more spending than the opposing white group does. Politically, the best strategy for Republicans is probably to highlight Democratic attitudes on things like religion, drug legalization*, and abortion and hope that reduces NAM voters' enthusiasm for going out and voting.

GSS variables used: RACECEN(1)(2, 15-16), POLVIEWS(1-2)(6-7), YEAR(2000-2010), ABANY, GRASS, MARHOMO, PRAYER, SPANKING, LETDIE1, SPENVIRO, SPARMS, GUNSALES, GRNEXAGG, AFFACT, SPUNEMP, CAPPUN, EQWLTH, PORNLAW, SPARTS, SPHLTH, CONARMY, LETIN, NUKEELEC

* Because of its pervasiveness among the (largely NAM) underclass, lots of whites presume that non-whites are amenable to the idea of decriminalizing drug use. I've spent enough time around blacks to know that among those who aren't users, the stuff is not smiled upon. Blacks living in the hood see its consequences firsthand and they don't like it anymore than you or I do.

Sunday, January 16, 2011

In a previous post where I examined self-reported levels of confidence in the US military among straights, gays, and bisexuals, as well as incidentally looking at the same by political orientation, TwoYaks noted that the time period used mirrored the beginning of the war in Afghanistan to the present. As Afghanistan and especially Iraq have been Republican initiatives, this leads to the conclusion that political conservatives have greater lasting confidence in the military as an institution than liberals do, when it could be the case that a war to ensure southern Sudanese independence would be more popular with liberals than with conservatives, and consequently the war in Sudan would lead to an inversion of confidence levels by political orientation, or at least something closer to parity.

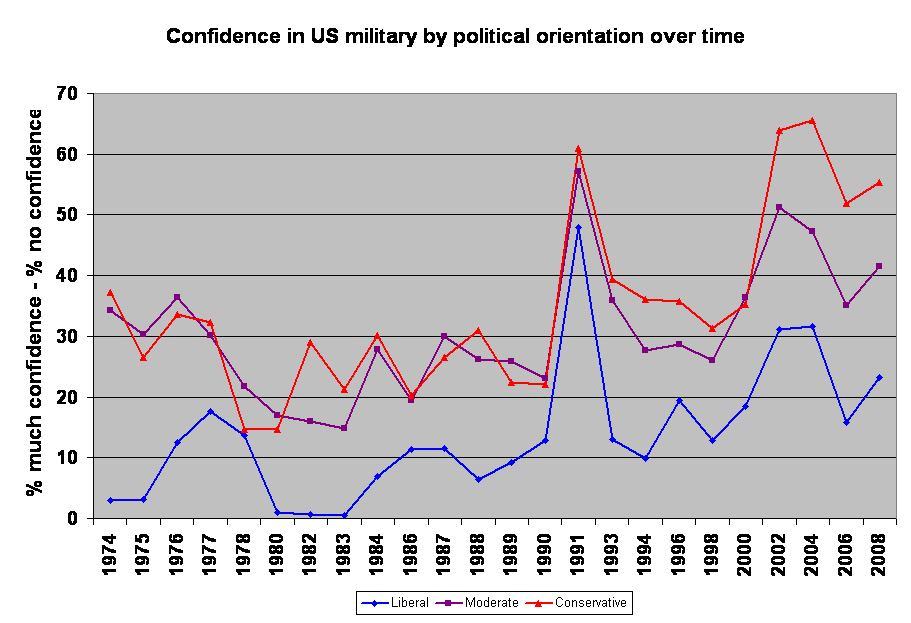
His reasoning sounds entirely plausible, and as I'm consistently reminded that attitudes in the new millennium are not necessarily continuations of those of the nineties, eighties, etc, looking at the data struck me as worthwhile. The following graph shows the level of confidence by political orientation from the beginning of the GSS four decades ago. The confidence index is derived by taking the percentage of respondents reporting a "great deal" of confidence subtracted by the percentage reporting "hardly any" confidence (the effect of those reporting "some" confidence is thus neutralized):


As US involvement in Vietnam wound down, liberal confidence increased, while that of the rest of the country, presumably due to perceived failure there, declined. During the Reagan years, when military spending was ratcheted up, liberal confidence dropped back down to the floor, while the rest of the country maintained the same sentiments from the mid-seventies through the end of the eighties.

The Gulf War jettisoned public confidence in the military across the political spectrum. It was the perfect desert storm; an aggressive dictator invading a more peaceable neighbor to steal its resources, international 'consensus' of just that narrative, a battle terrain ideal for conventional warfare in which the US had no competitor, and a resounding victory with minimum casualties and somebody else picking up much of the tab (the Saudis).

The bombing campaign against Serbia in 1999, in contrast, didn't have anything close to the same effect.

Post-911, reported levels of confidence in the US military has increased across the board, but the degree of increase has been most pronounced among conservatives, who were almost indistinguishable from moderates in their confidence in the three preceding decades. In 2006--the worst year of the Iraq war in terms of US casualties and about the time the popular right began questioning US involvement there--saw a dip of confidence from which there has yet to be a full rebound.

Vietnam offers a rebuttal, but over the last thirty years or so, it seems that when the US is engaged in some foreign conflict, confidence in the military is higher than when there aren't any forces deployed in combat zones. The Buchananite paleocon vision of a strong, capable military that nonetheless is used sparingly and only when the US national interest is at stake seems practically unattainable. Unfortunately so, in my opinion.

GSS variables used: CONARMY, YEAR, POLVIEWS(1-3)(4)(5-7)

Wednesday, January 5, 2011

Gays dislike US military?

A couple of weeks ago, OneSTDV explained why he was not surprised by the left's emphatic celebration at the repeal of don't ask, don't tell even though the left is generally hostile towards the military:
The left despises the military and sees our armed forces as a modern incarnation of the rapacious Colonial settlers. Thus, one would seem confused by their excitement over DADT repeal. If we accept the leftism perspective on the military, this basically means that now gays can openly kill oppressed peoples too. Not sure why that's cause for celebration.

Yet, leftism isn't defined by internal consistency - it's defined by convenience and reflexive opposition. As in, the left will champion any discordant ideal as long as the end result undermines some traditional aspect of our nation. Gays don't like the military or the values it reflects [my emphasis]. But because the military represents a bastion of nationalism and traditionalism, leftists want to fundamentally change it into an societal edifice in line with their worldview.
He may have meant to replace the phrase "Gays don't" with "The left doesn't", as that would preserve the same flavor of the rest of the paragraph. But it made me wonder if there is any discernible evidence suggesting that gays dislike the military or its values relative to the rest of society.

The GSS doesn't solicit a moral judgment of the military or its values, but it does consistently query respondents about how much confidence they have in various institutions, the military being one of them. The following table shows the levels of confidence straight, bisexual, and gay men and women have of the military, as well as the level of confidence self-described liberals, moderates, and conservatives have in it. For contemporary relevance, all responses are from 2000 onward:

Confidence:
Much
Some
Little
Conservatives
57.6%
36.7%
5.7%
Straight men
54.6%
36.5%
8.9%
Bi men
54.1%
34.7%
11.3%
Moderates
49.1%
42.2%
8.7%
Gay men
48.0%
43.2%
8.9%
Lesbians
46.1%
37.7%
16.1%
Straight women
45.5%
45.0%
9.6%
Bi women
40.1%
36.1%
23.8%
Liberals
39.0%
43.8%
17.3%

Gay guys are a little less gung-ho than straight and bisexual men are, but the gender divide is more significant. Gay men are right in line with political moderates (both sexes). Somewhat surprisingly, gay women display marginally less confidence in the military than heterosexual women do. This despite the conventional assumption that the gay percentage is far higher among female military personnel than it is in the general population. Bisexual women tend to be self-styled members of the avant garde, however, so their 'leftist' disposition is expected.

It seems more accurate, indeed, to say that leftists, rather than gays, dislike the military and what it stands for.

GSS variables used: NUMMEN(0)(1-950), NUMWOMEN(0)(1-950), SEX(1)(2), YEAR(2000-2008), CONARMY, POLVIEWS(1-3)(4)(5-7)

Friday, December 31, 2010

++Addition2++I was thinking of a comment Jason Malloy made on a post of Razib's a few years ago rather than something from Inductivist.

++Addition++
In the comments, an anonymous reader presents an alternative table measuring partisan differences in terms of standard deviations. Rather than comparing popular support in each party, it compares underlying attitudes towards each of the issues examined.

---

Following up on the previous post in which we looked at the size of political divides on a host of issues, the same process is repeated here, based on partisan self-identification rather than political orientation. For consistency, the items are measured in a way that affirmation of the statement represents what is putatively thought to be the Democratic position. For contemporary relevance, all responses are from 2000 onward:


DemIndRepDif
Gov't should definitely provide healthcare for the sick66.563.036.230.3
Same-sex marriage should be legalized46.134.922.124.0
Military spending is too high35.028.711.923.1
Taxes on the rich are too low56.245.934.421.8
Outlaw capital punishment for murderers40.131.319.820.3
Gov't has an obligation to help blacks specifically26.014.57.518.5
Abortion should be legal in all circumstances47.636.331.016.6
Man evolved from other animals57.650.741.516.1
Homosexual relations are morally acceptable39.130.723.215.9
Police permits should be required for gun ownership86.482.972.314.1
Marijuana usage should be legalized40.835.826.913.9
Affirmative action for blacks does not hurt whites39.333.927.411.9
Attend religious services less than once a month54.962.144.810.1
Have never been married26.828.517.29.6
No belief in or uncertainty over the existence of God40.237.232.47.8
Prayer in public schools should be banned43.740.136.86.9
Assisted suicide allowed for those with terminal illnesses61.760.556.75.0
Immigrants pose no threat to English language69.567.665.73.8
Hispanic immigration should not be decreased57.454.754.52.9
Science does more good than harm60.348.163.7(3.4)

Even though the healthcare question was only asked in 2006, the political divide existed prior to the passage of Obamacare. I suspect the gap is even wider today.

Same-sex marriage is again shown to be among the day's most polarizing issues. As an aside, you will rarely hear major media sources referring to it as such, however, because the word is usually reserved for describing populist issues pushed by the right that the left doesn't like, such as tougher immigration enforcement. Consequently, it has negative connotations, and nothing relating to homosexuality is allowed to be negative. Taxation, defense spending, and capital punishment are also starkly defined by partisanship.

Most noticeable is that Democrat-Republican divides (averaging 13.5 points) are narrower than liberal-conservative divides (averaging 20.8 points) are. Specifically, as a group, liberals are considerably further to the left than Democrats are. The biggest differences show up on the gay issues, drug legalization, abortion, school prayer, assisted suicide and personal belief in God. Clearly there are many white Democrats (and a slew of NAMs) who, despite being in partisan alignment with SWPLs, are nonetheless the wrong kind of white people.

The levels of support among conservatives and Republicans are virtually identical on almost everything, the only marginal exceptions being on defense spending (conservatives are more likely to want to cut it than Republicans) and the legal right to assisted suicide (Republicans are slightly more inclined to the idea than are conservatives). But even on these two things, the conservative-Republican gap is not even half of what it is among liberals and Democrats on the issues listed above.

Despite the perceptions that Republicans and especially conservatives stand in opposition to scientific progress because of skepticism over evolution or lack of support for government funding of embryonic stem cell research, luddites are no more prevalent on the right than they are on the left. I recall Inductivist having shown that, excepting the aforementioned "hot button" issues, those on the right are as scientifically literate as those on the left, though I'm frustratingly unable to find that post at the moment (please point me to it in the comments if you're aware of what I'm recalling).

GSS variables used: ABANY, GRASS, HOMOSEX, PRAYER, HELPBLK, DISCAFF, MARHOMO, GUNLAW, TAXRICH, CAPPUN, ENGTHRTN, GOD, ATTEND, SUICIDE1, HARMGOOD, EVOLVED, MARITAL, SPARMS, LETINHSP, YEAR(2000-2008), PARTYID(0-2)(3)(4-6)

Tuesday, December 28, 2010

When reading about politics outside of the US, I have to be wary of the presumption that descriptors such as "liberal" or "conservative" have the same connotations there as they do here. It's a two way street, of course, so the following may be of use to readers outside America.

But it also has utility for those in the states. I was recently in a discussion where the topic of what issue most starkly divided liberals from conservatives came up. I guessed that it was either abortion or taxes, but had to admit to being uncertain. Without any false modesty, as it turns out.

The following table shows the differences among self-described liberals, moderates, and conservatives on several different political issues, as well as a few broad lifestyle measures. The fifth column shows the difference between liberals and conservatives by subtracting the percentage of conservatives in agreement from the percentages of liberals in agreement. For consistency, the items are measured in a way that affirmation of the statement represents what is conventionally thought to be the liberal position. For contemporary relevance, all responses are from 2000 onward:


LibModConDif
Same-sex marriage should be legalized61.836.919.941.9
Homosexual relations are morally acceptable51.632.318.633.0
Abortion should be legal in all circumstances57.340.427.330.0
Gov't should definitely provide healthcare for the sick69.156.241.028.1
Man evolved from other animals66.251.739.227.0
No belief in or uncertainty over existence of God53.435.728.225.2
Military spending is too high42.421.917.425.0
Marijuana usage should be legalized50.335.125.724.6
Taxes on the rich are too low55.652.533.022.6
Attend religious services less than once a month63.856.441.822.0
Assisted suicide allowed for those with terminal illnesses72.560.851.121.4
Outlaw capital punishment for murderers44.029.722.721.3
Prayer in public schools should be banned54.237.834.220.0
Gov't has an obligation to help blacks specifically28.415.910.318.1
Have never been married34.122.918.315.8
Police permits should be required for gun ownership86.982.073.813.1
Affirmative action for blacks does not hurt whites40.232.230.89.4
Immigrants pose no threat to English language71.368.662.09.3
Hispanic immigration should not be decreased63.152.156.07.1
Science does more good than harm62.657.161.01.6

Same-sex marriage (and gay issues in general) trumps abortion in divisiveness. That gay marriage, abortion, defense spending, evolution, healthcare spending, and belief in God are the most polarizing issues in contemporary US society while affirmative action, immigration restrictionism, and government largess for blacks are far less firmly associated with political orientation is discouraging (though not surprising) from my particular vantage point, as someone who identifies in the vernacular as a conservative (and an "empirical paleoconservative" in situations where such phraseology won't be met with annoyance and/or confusion). The things I, alongside many others in the Steveosphere, find most important are not the things mainstream conservatives differ from the left on the most.

On theism, military spending, prayer in public schools, and affirmative action, moderates and conservatives are well aligned, while on the taxing of the rich, moderates and liberals are on the same page. Liberals are significantly less likely to believe in God or have ever been married than moderates or conservatives. On everything else (excepting the last two, for which political orientation has little relevance), moderates fall roughly halfway between liberals and conservatives.

Parenthetically, the GSS is weak on items relating to immigration. A question much preferable to the vague and loaded one about English being threatened by immigrants (xenophobes always feel threatened by the "other"!) would be one that simply asks whether immigration to the US should be increased or decreased, but such a question has not been asked. The closest we get is a set of questions posed in 2000 asking alternatively whether Hispanic, Asian, and European immigration should be increased, left the same, or decreased. While sentiment is generally restrictionist regarding immigration into the US (especially illegal immigration), whenever immigrants are defined anymore specifically than simply being aspiring immigrants, that restrictionism shows itself to be pretty thin. Immigration has nothing to do with biology or even culture, it's about the rule of law!

GSS variables used: ABANY, GRASS, HOMOSEX, PRAYER, HELPBLK, DISCAFF, MARHOMO, GUNLAW, TAXRICH, CAPPUN, ENGTHRTN, GOD, ATTEND, SUICIDE1, HARMGOOD, EVOLVED, MARITAL, SPARMS, LETINHSP, HLTHCARE, YEAR(2000-2008), POLVIEWS(1-3)(4)(5-7)

Sunday, August 29, 2010

On isolationism and the drawdown in Iraq

The following comes from part of a facebook discussion (an appropriate venue for such polemics, I know!) that resulted from one of my status updates (FB's response to tweets). For better or worse, I'm heavily indebted to Pat Buchanan for the tack I take in my approach to US history. Comments and corrections in my understanding will be much appreciated.

---

Status: Fewer than 50,000 military personnel left in Iraq, something I'm proud of my President for. Now just 100,000 in Afghanistan, 66,000 in Germany, 54,000 in Japan, 30,000 in Kuwait, and 30,000 in South Korea to go. A republic, not an empire.

[Keenan wrote: Would we risk further instability in the world by returning to an isolationist foreign policy?]

Keenan,

Prior to our entry into WWI, Jefferson doubled the size of the US by buying up over 800,000 square miles of land from the French (who, had we have been more meddlesome in European affairs, would've been more hostile towards us than they were following the naval Quasi-War we'd had with them from 1798-1800) at less than $20 a square mile. Jefferson also oversaw the creation of the US Navy in response to the plundering of merchant ships by Barbary corsairs in the Atlantic and Mediterranean that had been going on for centuries.

James Madison took much of contemporary Florida from the hands of the Spanish empire and attempted to invade and conquer Canada.

The war hero and future President Andrew Jackson invaded what was left of Florida and kicked the Spanish governor across the water into Cuba. The result was complete US control of what became the sunshine state.

James Monroe, who sent Jackson to take Florida, declared during his Presidency the Monroe Doctrine, essentially telling the rest of the world to butt out of US affairs in the Western Hemisphere.

John Tyler annexed Texas. Instead of implicitly ceding the American Southwest to the Mexicans as we are apt to do today, he explicitly took its greatest part from them.

James Polk followed that up by chopping off the northern half of what was then Mexico (the California, Arizona, Utah, Nevada, and New Mexico of today) at a bargain-basement price in the treaty of Guadalupe Hidalgo.

Commodore Perry is probably more famous in the annals of Japanese history than in US history for forcing open trade between that formerly cloistered country and the West. He didn't remain stationed in Okinawa for six decades, though--he was back home in the US a year later.

In 1853, President Franklin bought up the remainder of Mexican-controlled territory (including modern-day Tucson) that would eventually become part of the US.

The US, under Andrew Johnson, supported Mexico's struggle for self-rule in opposing the French suzerainty that had been installed there by Napolean's nephew.

William Seward bought Alaska. He was less successful in acquiring Hawaii, British Columbia, Greenland, and the Virgin Islands. But he tried for those, too.

During Rutherford Hayes' administration, we almost went to war with Germany over questions over the status of the Samoan Islands.

William McKinley went to war with Spain, invaded Cuba, gave the US control of Puerto Rico, maintained US influence in the Philippines, used American troops to put down the Boxer Rebellion, and forced open trade between China and the rest of the West as Millard Fillmore had done in Japan half a century before.

Teddy Roosevelt made sure the Panama Canal was completed and mediated the treaty following Japan's surprising victory over Russia in 1904.

All that during the so-called period of US isolationism. We didn't isolate ourselves from the rest of the world. Instead, we acted on the world stage when it was in our best interests, not on behalf of some entangling alliance or in defence of some universal proposition about the equality and civil rights of all man(and woman!)kind

My amateurish understanding of history freely admitted, I am not of the opinion that what the US has done since then--exported messianic liberal democracy on the barrel of a gun--has done us much good. World War I is widely regarded as a pointless bloodletting (Western Civilization's first Civil War, really). The Korean War? Vietnam? The Balkans? The war in Iraq? A decade in Afghanistan?

More controversial is criticism of our entry into WWII, but by starving the Japanese of energy while they were at war with China was a primary reason for Japan's attack on Pearl Harbor. Hitler honored his alliance with Japan and declared war on us a couple days later, but had we not sent American troops into Europe, it's questionable as to how and where any military confrontations between the US and Germany would've commenced. Instead, at great cost in blood and treasure, we knocked out the Nazis before they'd done all they could've done to the Soviets. As a result, we got Stalin, who murdered millions more people than Hitler did, and a Cold War that lasted over four decades and ensconced in our economic fabric the military-industrial-congressional complex that underlies the countless "defense" boondoggles taxpayer dollars have been squandered on ever since.

That rebuttal to the derogatory "isolationist" charge aside, US military personnel constitute almost 70% of all foreign deployments worldwide. We have nearly 400,000 boots on the ground outside of the US. The rest of the world combined, by contrast, has a total of about 175,000 spread across the entire globe. If our soldiers come home from their extended vacations in Germany, the US embassy in Berlin will not be closed down. The Germans will still export BMWs to us. We will still export jets to them.

Instead of establishing permanent military bases throughout Europe and Asia, why not maintain a foreign policy stating that if you attack us or facilitate those who do, we're going to strike back an order of magnitude more ferociously (and then some), reducing your domestic military installations to rubble, killing your leaders, and aiming our nuclear arsenal at you just in case that response isn't enough to set you straight--then we're going to get out and leave the cleanup to you and your despondent citizenry?

As Landon rightly points out, China is establishing soft influence all over the place--in the Middle East, Africa, South America, the rest of Asia--without any overseas military bases or deployed soldiers to speak of. I don't even think they have an outpost in North Korea (although I could be off on that).

[Evan wrote: I'm sure South Korea wouldn't appreciate our departure.]

Evan,

Polls show that most South Koreans--by about a 55%-45% margin--want the US to extirpate itself militarily from their country (there is a generational divide on the issue, with older Koreans being more amenable to our presence than younger Koreans are). South Korea's economy is 20-30 times the size of the North's. Its military expenditures are four times the North's, and its population is more than twice that of its northern neighbor. Why are we footing the bill and putting our guys at risk on behalf of an ungrateful nation that can (and should!) defend itself?

Saturday, May 29, 2010

Militarily fit-to-serve by state (round 2)

Last weekend, I created a "fit-to-serve" index by state. As I was constructing it, it felt like too much emphasis was being put on the percentage of each state's population on parole, on probation, in jail, or in prison. So I went back and reworked the numbers in to create a more straightforward, less arbitrary way of measuring eligibility by state--I simply added the totals of the three inhibiting factors together and then subtracted that sum from 100 to get the percentage of each state's young adult population that is deemed potentially fit-to-serve in the military*:

StateEligible %
1. Vermont59.8
2. Minnesota59.2
3. Wisconsin57.4
4. Iowa57.1
5. North Dakota55.4
6. Connecticut53.0
7. Montana52.7
8. Utah52.4
9. New Hampshire51.9
10. South Dakota51.5
11. New Jersey50.1
12. Pennsylvania49.4
13. Maine48.8
14. Missouri48.2
15. Oregon48.0
16. Wyoming47.4
17. Maryland47.3
18. Massachusetts46.8
19. Nebraska46.7
20. Colorado46.6
21. Idaho46.4
22. Kansas46.1
23. Oklahoma45.6
24. Rhode Island44.2
25. Hawaii42.9
26. Michigan42.3
27. Ohio42.0
28. Virginia41.8
29. Washington41.7
30. Illinois41.4
31. West Virginia40.5
32. Indiana40.2
33. California37.2
34. Kentucky36.1
35. Arizona36.0
36. Texas35.5
37. Delaware35.2
38. New York34.1
39. Tennessee33.5
40. Arkansas32.6
41. North Carolina32.4
42. Alaska32.2
43. Florida28.8
44. Alabama27.9
45. New Mexico23.1
46. South Carolina22.4
47. Louisiana21.2
48. Georgia19.3
49. Mississippi17.4
50. Nevada15.9
51. District of Columbia15.2

What immediately jumps out is how white (and geographically concentrated in the upper Midwest and Northeast) the states with high eligibility are compared to those with more modestly sized eligible populations. The correlation between the percentage of a state's population that is white and the percentage of the young adult population deemed eligible for military service is .67 (p = 0).

So much for the idea of granting citizenship to immigrants upon some set duration of military service--unless they are among the sliver of newcomers hailing from Europe, they won't be able to get in! Because far less than 1% of the adult population is actually serving in the military at any given time, to assert that the perpetual decrease in the proportion of the country's population that is white will make it difficult for the military to find potentially eligible recruits actually isn't justified (though being able to find willingly eligible recruits is a separate issue).

The report's public authors, a cadre of retired military officers, do not mention the demographic angle (nor should they, as it is of course irrelevant!). They do emphasize the putative benefit of early education in reducing criminality and increasing the likelihood of on-time graduation throughout, though--in fact, the report is subtitled "Early Education across America is Needed to Ensure National Security"!

Then, without any apparent sense of self-defeat, the report's appendix includes a table showing the percentages of each state's 4-year-old populations enrolled in pre-kindergarten schooling. This measure inversely correlates with latent graduation rates at a statistically insignificant .09 (p = .53) and probation or incarceration rates at a similarly statistically insignificant .06 (p = .69). That is, early education is not associated with desirable social outcomes like on-time high school graduation and steering clear of the law at the state level, despite the praise heaped upon early education and its supposed long-term benefits.

In the comment thread of the previous post, Silly Girl, perspicaciously detecting the lack of any relationship just by eye-balling the table, remarked:
Ugh, page after page of that report trumpeting the benefits of pre k education, then on page 7 the charts of pre k ed. and graduation rates showing no relationship to graduating based on going to free public pre k. Do they think people can't read and think? Okay, dumb question. Do they think no one, even the more educated folks who likely would read it, would question it?
Kurt9 didn't see anything intentionally furtive going on:
People in bureaucracies don't think, period. Its not that they thought they could slip this report past readers without them reading it critically. Its that they did not even think about this at all.
Whatever the explanation, it is, in the literal sense of the word, ridiculous.

Parenthetically, reassuring me that this method is superior to the index I previously created, the correlation between estimated average IQ and the percentage of the young adult population deemed eligible for military service is .78 (p=0) (IQ correlated with my "fit-to-serve" index at .54); as always, desirable social outcomes and intelligence go hand-in-hand.

* This method assumes no overlap among the three inhibiting factors, even though there likely is a significant amount of it--I suspect failing to graduate from high school on time, being overweight, and scuffling with the law all correlate positively with one another. But I see little reason to suspect the amount of overlap varies significantly by state--that they are likely correlated (the report from which the data come does not attempt to tease out what the true percentage of each state's population deemed eligible for service actually is) means the table above inflates the percentages of state populations deemed ineligible for military service, but in a systematic way that doesn't materially effect some states more than others.

Saturday, May 22, 2010

Military fit-to-serve index by state

A report released a few months ago assessing the percentage of those aged 17-24 able to serve in the US military found three quarters unable to do so. That a majority of young Americans are deemed unfit to serve stems from three major causes: Poor health (including obesity), failure to graduate from high school, and the carrying of some sort of criminal record.

Data are reported for each of these inhibiting factors at the state level. Some people are unfit on more than one dimension, so it's not possible to calculate what percentage of each state's young adult population is able or unable to serve (given the percentages for each category, even if there was no overlap, statewide figures do not add up to 75% or more), and the report does not list statewide totals. So I have created a fit-to-serve index* based on these three major inhibiting factors. Higher values indicate a greater portion of the population being eligible for military service:

State
Index
1. New Hampshire
159
2. Maine
149
3. North Dakota
138
4. Utah
136
5. Iowa
131
6. West Virginia
128
7. Vermont
126
8. Kansas
119
9. Montana
117
10. Wisconsin
117
11. South Dakota
112
12. Nebraska
111
13. Oklahoma
108
14. Virginia
108
15. Connecticut
107
16. Minnesota
107
17. New York
107
18. New Jersey
106
19. Wyoming
106
20. Missouri
105
21. Oregon
102
22. Illinois
100
23. Pennsylvania
99
24. Colorado
97
25. Hawaii
96
26. Maryland
96
27. California
94
28. Tennessee
94
29. Massachusetts
93
30. Washington
93
31. Kentucky
92
32. Rhode Island
92
33. Michigan
91
34. North Carolina
91
35. Arizona
90
36. Alaska
89
37. Ohio
89
38. Idaho
88
39. Indiana
88
40. Nevada
84
41. Arkansas
83
42. Delaware
83
43. Alabama
81
44. Florida
81
45. South Carolina
81
46. Texas
80
47. New Mexico
79
48. Mississippi
76
49. Louisiana
69
50. District of Columbia
59
51. Georgia
58

Fairly predictable, with a couple of exceptions. As is the case with so many other measures of desirable attributes, IQ correlates with the fit-to-serve index at .54 (p=0)

Massachusetts and Minnesota are both relatively far down the list compared to how these states measure on most desirable state rankings due to having the 5th and 7th highest, respectively, percentages of adults on parole, probation, in jail, or in prison among the states. Massachusetts' crime rates are surprisingly high for being an affluent, mostly white northeastern state that consistently tops the NAEP charts. I am not sure why Minnesota finds so many people on the wrong side of the law--the state's reported non drug-related crime statistics are stellar. Are there cities in Minnesota that are drug trafficking hubs for contraband coming in from Canada? Or am I missing something else?

Another interesting bit turned up in looking at per capita service rates by state. While red state populations are essentially no more (or less) able to serve than blue staters are--the correlation between ability to serve and voting for McCain in 2008 is a meaningless .06 (p=.69)--they are considerably more willing to do so. The correlation between the percentage of a state's population that signs up for military service and support for McCain in 2008 is .49 (p=0). Republicans are said to reserve greater hostility for the government than Democrats do, but in the case of the military, the parties have swapped spots.

* 118 + X (where X is 1 in every X adults in a state are on parole, probation, in jail, or in prison) - % of those aged 10-17 who are obese - % of those who fail to graduate from high school on time
ban nha mat pho ha noi bán nhà mặt phố hà nội