RSS
Facebook
Twitter

Showing posts with label IQ. Show all posts

Saturday, October 12, 2013

Although the 2012 GSS did not include any questions on presidential voting plans for the same year, the survey did sneak in a question on presidential approval, querying respondents on whether they approve or disapprove of the way Barack Obama is handling the job of president. Because it's fun and often causes people to make fools of themselves, here are IQ estimates derived from wordsum scores for those approving and disapproving of Obama's performance, presuming an average national IQ of 98 and a standard deviation of 15:

Approve -- 97.7
Disapprove -- 98.5

A nation divided. Race, of course, is a confounding factor. When only non-Hispanic whites are considered:

Approve -- 101.5
Disapprove -- 99.3

Per usual, white leftists could appear more credible in the supercilious scorn they have for their bigoted brethren if they acknowledged as much. Since they're afraid to do so, however, let it be known that Obama's supporters aren't quite as intelligent as his detractors are!

More insightfully, the GSS results provide a useful illustration of what the Derb terms "classic class conflict: the top and the bottom against the middle". The following graph shows Obama's approval/disapproval numbers among members of five categories in which respondents are classified based on their wordsum scores*:


If only I could remain stuck in the middle with you. Unfortunately, stasis appears to be a dream of the past, not the way of the future.

GSS variables used: PRESPOP, WORDSUM(0-3)(4-5)(6)(7-8)(9-10), RACECEN1(1)

* Respondents are broken up into five categories that come to roughly resemble a normal distribution; Really Smarts (wordsum score of 9-10, comprising 13% of the population), Pretty Smarts (7-8, 26%), Normals (6, 22%), Pretty Dumbs (4-5, 27%), and Real Dumbs (0-3, 12%).

Saturday, September 14, 2013

Randall Parker points to a CNBC article focused on unfunded pension liabilities at the state level that is packed with quite a bit of data on the financial condition of the fifty. I've been after something like this for several years.

There are multiple ways to view the numbers, but probably the most broadly informative involves adding together current state debt and unfunded pension liabilities going forward and then looking at these on a per capita basis. That is, determine the dollars each resident of a state is putatively on the hook for at present to pay what the state currently owes and will expect to additionally owe beyond its projected funds on hand. Of course, debt can be defaulted on and promises reneged--realistically, that, in tandem with some combination of currency devaluation, is my best guess for how this unsustainable situation eventually resolves itself, with varying levels of disruption at varying times in the future.

The following table shows per capita debt-plus-future-obligations ("debt" going forward), with the financially healthiest states at the top of the list and the least solvent states at the bottom:

StatePerCap$
1. South Dakota513
2. Tennessee847
3. Idaho969
4. Nebraska1,046
5. North Carolina1,138
6. Texas1,514
7. Wyoming1,982
8. Wisconsin1,982
9. Iowa2,296
10. Florida2,320
11. Missouri2,426
12. Georgia2,436
13. Vermont2,688
14. Arkansas2,695
15. Indiana2,707
16. North Dakota2,726
17. Maine2,756
18. Utah2,785
19. Arizona2,939
20. Washington2,961
21. Oklahoma3,237
22. Delaware3,265
23. South Carolina3,487
24. Michigan3,535
25. New York3,548
26. Minnesota3,606
27. Alabama3,746
28. New Hampshire3,762
29. Virginia4,035
30. Montana4,042
31. West Virginia4,223
32. Pennsylvania4,284
33. Kansas4,402
34. Oregon4,611
35. Nevada4,801
36. Maryland4,864
37. Colorado4,996
38. Louisiana5,205
39. California5,650
40. Mississippi5,882
41. Rhode Island5,901
42. New Mexico6,554
43. Ohio7,025
44. Kentucky7,322
45. Massachusetts7,455
46. New Jersey8,480
47. Illinois9,056
48. Hawaii9,878
49. Connecticut10,776
50. Alaska12,363

A visualization of the data with figures is available here, and is reproduced without interaction below:


No blatant trends jump out. Sparsely populated, mostly white flyover states in close proximity of Canada tend to be in the best shape, with the major exception of Alaska. Thank goodness for that petroleum dividend--suspend payouts for a decade or so and the problem is solved!

Illinois, the nation's most demographically representative state, similarly serves as one of the states that comes closest to serving as a microcosm for the nation as a whole, though even it comes up well short. While Illinois' residents are looking at a little north of $9,000 in debt peonage per, these state-level obligations pale in comparison to the debts and empty promises of the federal government, for which debt alone is currently running over $50,000 per person.

The article opens by attributing Detroit's municipal bankruptcy to "underfunded retirement promises to public sector workers". Tautologically so, but no doubt haters have made attributions of their own that are hatefully racist and racially hateful. The correlation between a state's Ice People (non-Hispanic white + Asian) population percentage and its debt is an inverse .21. It runs in the direction haters expect it to run in, though it's a tepid relationship.

How about something to Sean Hannity's taste? The correlation between debt and Obama's share of the 2012 presidential vote is a more robust .39. Blue states really do tend to be less fiscally responsible than red states even though blue states generally have more human capital to work with.

Speaking of human capital, the inverse correlation between debt and estimated state IQ is a statistically insignificant .06. The relationship between median age and debt is more feeble still, at .03. It might be nice to think that the states that have the most time to formulate viable solutions before the bills start coming due en masse are the ones who need that time the most, but alas it isn't so.

In addition to having, on average, modestly less intelligent populations than blue states, red states also tend to be fatter. In light (heh) of the above, then, it comes as little surprise that debt and obesity inversely correlate at .23. In this case, it looks like it's possible to have your cake and eat it, too--those public service health campaigns in Connecticut aren't doing the nutmeg state's bottom line any good!

Parenthetically, as a supporter of full Puerto Rican independence, I can now point to the fact that the island's per capita debt, at $12,487, is higher than that of any state in the union. While Puerto Ricans may not be as affluent as Americans, they're even better at spending money they don't have than we are. Really, what do they need us for?

Monday, April 1, 2013

Skin tone and IQ, and volunteering, too

The 2012 data from the GSS has been released for public consumption. Apparently (and beautifully) oblivious to PC etiquette, the GSS asked interviewers to assess the skin tones of the survey respondents they interviewed. The following graph shows the relationship between skin tone and wordsum results, a quick ten question vocabulary test that correlates pretty well with IQ (n = 1,119):


There is some noise on the dark end due to small sample sizes in the 8-10 range. Excepting that, we get confirmation of the stereotype that ice people are more, uh, bookish than hipper sun people are.

To get under leftists' skin (heh) even more, the percentages of people who have volunteered through or for an organization over the last year, by political orientation:

PolsVols
Liberal40.6%
Moderate35.5%
Conservative49.0%

When it comes to volunteerism, one of our demographic groups is assimilating to the norms of old America. The other? Not so much. By race:

RaceVols
White41.0%
Black39.7%
Asian40.3%
Hispanic26.7%

Morality doesn't need religion! Humanism is my religion! Just because you go to church on Sunday doesn't make you a good person! Volunteerism over the last year, by frequency of worship attendance:

AttendVols
Never21.7%
Less than monthly36.2%
Less than weekly43.7%
Weekly+60.4%

GSS variables used: WORDSUM, RATETONE, POLVIEWS(1-3)(4)(5-7), VOLACTYR, RACECEN1(1)(2)(4-10)(15-16), ATTEND(0)(1-3)(4-6)(7-8)

Thursday, February 28, 2013

Counting blue gods

Like children often do, I have many questions. To the GSS I say, "Tell me all your thoughts on God". The following graphs show the percentage distributions for four categories of theistic belief across a host of usual-suspect variables. For contemporary relevance, all results are from 2000 onward. By race:


By sex:

 By political orientation:
By partisan affiliation:


By community type at the age of 16:


By social class:


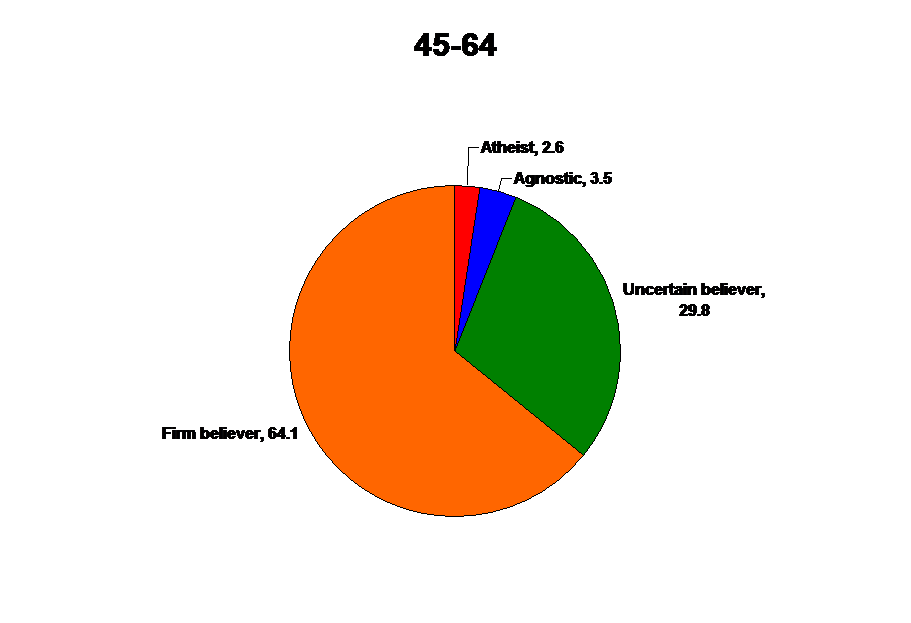
By age range:


By intelligence*:


By educational attainment:


The quintessential atheist is a high IQ, upper class, urban, white (or Asian), young, liberal Democratic guy with a doctorate. Firm belief is pretty much the norm across the board and a plurality just about anyway one broadly slices it, but the further one moves away from the quintessential atheist, the more theistic things become.

GSS variables used: GOD(1)(2)(3-5)(6), RACECEN1(1)(2)(4-10)(15-16), SEX(1)(2), POLVIEWS(1-3)(4)(5-7), PARTYID(0-2)(3)(4-6), RES16(1-2)(3-4)(5-6), CLASS, AGE(18-29)(30-44)(45-64)(65-89), -WORDSUM(0-3)(4-5)(6)(7-8)(9-10), EDUC(0-11)(12)(13-15)(16-17)(18-20), YEAR(2000-2010)

* For intelligence, respondents are broken up into five categories that come to roughly resemble a normal distribution; Really Smarts (wordsum score of 9-10, comprising 13% of the population), Pretty Smarts (7-8, 26%), Normals (6, 22%), Pretty Dumbs (4-5, 27%), and Real Dumbs (0-3, 12%).

Saturday, February 2, 2013

IQ and homicide

The inverse correlation between mean white IQ (as estimated by NAEP scores) and the white homicide offender rate at the state level in the US is a statistically significant .67 (p = 0).

A few technical notes: Florida is excluded for lack of adequate FBI uniform crime reporting data. "White" includes Hispanics who racially identify as white. To compute the total white NAEP scores for each state, I took NAEP results for 8th graders from 2005 and then weighted the non-Hispanic white and Hispanic scores according to how much of the total white test-taking population each comprised. For the states in which the Hispanic population is too small to be reliably reported, I used the average Hispanic score from the states where the Hispanic populations are large enough for mean scores to be reported.

Intelligence doesn't just improve quality of life measures in a cerebral way, it also does the physical body good.

Thursday, January 3, 2013

Wordsum score and age at first marriage


Respondents who are not currently nor have never been married are excluded. Not as stark a trend as I would've guessed, but it runs in the predictable direction. My guess as to why those of the most modest intelligence actually buck the it to some extent is due to a lack of prospects and very delayed emotional and psychological maturation. Only 1% of respondents failed to answer a single wordsum question correctly, so we're looking at the mentally handicapped here.

GSS variables used: AGEWED, WORDSUM, BORN(1)

Saturday, October 20, 2012

Intelligence and fertility by class, over time

Channeling Charles Murray, Randall Parker comments on the increasing social stratification that has come to define the contemporary Western world:
This isn't the 1950s when people could expect to pair up with a husband or wife and get a factory job that put them at similar status level to a large portion of the total population. We've got a much wider spread of classes and far more cognitive sorting. The poor are dumber on average and the upper classes are smarter on average. The classes have less in common: less shared understanding, fewer shared values, fewer shared experiences with cultural products such as TV and radio shows.
On the one hand, inequality has been public enemy number one for multiple generations now. On the other hand, one major consequence of a shrinking world is that cognitive sorting keeps getting easier to do and is continually approaching ubiquity in practice.

I wondered what insights the GSS might offer. The survey has a question for which respondents are asked which of four social classes they feel they belong to--lower, working, middle, or upper. The following graph shows mean wordsum scores by self-identified class membership over time. The three variables have not been cross-referenced for every year the survey has been conducted (not sure why, as each has independently been included since its inception, but it is what it is), which is why the years displayed jump around as they do. To avoid issues of English language fluency, the foreign-born are excluded:


Steady as she goes. Of course, this doesn't necessarily speak to potential changes in material or cultural class differences over the last several decades per se, but the cognitive sorting by class isn't blatantly obvious, at least not by this measure.

And because detecting dysgenic trends is a hobby horse here, the mean number of children by class over time:


Sample sizes are smaller for the lower and upper classes (self-assessment rates split about 5%-45%-45%-5%) so their respective lines bounce around more, but the pattern over time is pretty consistent--higher class means somewhat lower (and later) fertility, and people across the social spectrum are having fewer children today than their parents had.

GSS variables used: BORN(1), YEAR, CLASS, WORDSUM, CHILDS

Friday, September 21, 2012

Idiocracy is an old friend

Jayman has an interesting post showing that the positive correlation between fertility and political conservatism has existed in the US for nearly a century. Rifting off of this (okay, okay, copying it!), presented below are similar graphs tracing the relationship between fertility* and a couple of other angles I'm interested in--intelligence and educational attainment. To allow for family formation to have occurred, racial confounding to be avoided, and linguistic problems to be evaded, all included respondents were at least aged 35 at the time of their participation, non-whites are excluded, and the foreign-born are disregarded, respectively.

Firstly, fertility and intelligence by decade(s) of birth:


The dysgenic trend isn't anything new. We've putatively been moving towards Idiocracy for a century now. I use the qualifier because it is by no means clear that the average IQ of white Americans has declined in the last 100 years--to the contrary, it has probably increased.

Parenthetically, I find it neat to see the phrase "baby boomer" really come alive with the data.

And fertility and educational attainment by decade(s) of birth:


The correlation between education and fertility is much stronger than the correlation between intelligence and fertility is. The sixties cohorts illustrate this particularly well in the two graphs presented above. Of the 25 bars displayed in the latter graph, only two buck the otherwise perfect pattern of more education resulting in fewer children, and they are minor ("some college" among those born 1900-1919 and "bachelor's" among those born in the fifties). In the former graph showing the interaction between intelligence and fertility, there are several exceptions.

Here's to the education bubble bursting and a much more efficient, industrious method of imparting skills and knowledge to those rationally seeking them rising out of the dampness. The current structure isn't just financially wasteful and morally destructive--instilling in young adults a sense of entitlement to go along with a heavy debt burden and little in the way of marketable capabilities or competencies--it also plays a starring role in the death of the west.

* The averages are systematically overstated here as the GSS instructs survey participants to count not only their biological children but also step-children and those they've adopted.

GSS variables used: COHORT(1900-1919)(1920-1939)(1940-1949)(1950-1959)(1960-1969), WORDSUM(0-3)(4-5)(6)(7-8)(9-10), EDUC(0-11)(12)(13-15)(16-17)(18-20), BORN(1), RACE(1), CHILDS, YEAR(1985-2010)(1995-2010)(2005-2010)

Saturday, August 4, 2012

++Addition++Great comments. Using the GSS, Jason Malloy replicates what other studies have found regarding the urban/rural IQ gap in the US--that it has shrunk appreciably over the last three generations, but not due to rural areas catching up with urban ones. Instead, urban areas appear to have regressed while rural areas have treaded water:
I looked at urban/rural differences by birth cohort.

white's born 1900-1940
93 rural
100 suburb
102 city

white's born 1941-1969
95 rural
100 suburb
100 urban

white's born 1970-*
93 rural
96 suburb
96 city

The rural/urban difference has converged from 9 points to 5 points to 3 points across the three cohorts.
---

Continuing with the rural vs. urban IQ theme, let's consider the gaps among those of (relatively) shared ethnicity by the broadly based type of communities they were raised in. Ron Unz speculates that because urban dwellers outperform their bucolic counterparts on IQ tests and their proxies, groups that are skewed more heavily towards urban living and away from rural living are consequently more intelligent for it. The HBD chickadee poked some holes in Unz' initial assertions, but on net, the conclusion could plausibly follow from the contemporary data.

I wondered, though, if German and Dutch wordsum averages were lower because of a more rural skew than those of Italian and Irish descent, or if the differences were apparent among those of different ethnicities living in similar communities. The following table lists mean IQ values as estimated from wordsum scores by self-identified ethnicity among whites (with the exception of those of African descent) by community type. The last column shows the urban/rural gap. Due to concerns with sample sizes, the selection is somewhat limited. Unfortunately, Dutch numbers aren't high enough on the urban component for useful comparisons to be made:

AncestryRural IQSuburban IQUrban IQUrban advantage
Russian93.9103.1107.313.4
English/Welsh96.9103.3104.47.5
Scottish96.4102.1102.86.4
French96.699.2102.25.7
Polish94.599.7101.87.2
Irish93.7100.3100.97.2
Italian95.199.1100.65.5
German94.599.199.44.8
Native American89.293.696.67.5
African83.290.190.87.6
Mexican85.787.283.2(2.5)

With the exception of Mexicans, the trend is remarkably consistent. Rural rustics fare poorly, suburbanites are somewhere in the middle, and urban dwellers come out on top. That those of Mexican descent don't exhibit the same pattern that everyone else does, including blacks, makes Unz' argument that Hispanics will eventually get up to snuff with other Americans appear more than a little tenuous.

While the rural/urban gap is real, the presumption that the relative proportions of ethnics living in different community types accounts for the overall differences in intelligence isn't clear. Excluding Russians, about half of whom are Jewish with a heavy urban skew for Russian Jews and a non-urban skew for non-Jewish Russians, the overall differences between ethnic groups remain at each community level as well.

That is, the English and the Scottish outscore the Germans and the Irish in rural, suburban, and urban settings. It's not just that the Scottish are more urban than the Germans are, rural Scots outperform rural Germans and urban Scots outperform urban Germans. Since we're looking at the environments people grew up in as kids, it shouldn't take multiple generations for the urban premium to confer an advantage over rural living.

If Unz' theory was perfect, there would be no differences among varying ethnicity in rural environments, with the overall ethnic differences instead being accounted for by the fact that higher scoring ethnicities were skewed more heavily towards urban dwelling and less intelligent ethnicities skewed towards rural life. To the contrary, among white European ethnic groups, the correlation between rural mean wordsum scores and urban mean wordsum scores is a statistically significant, vigorous .78. Going from rural to urban helps everyone (except Mexicans!), but underlying differences remain irrespective of what community type is being considered.

Admittedly, this is stretching the suggestive value of wordsum scores as a predictor of intelligence to the maximum, and I'm not attempting to speak with authority about Unz' theory or the refutations of it here. I'm just offering up so more food for thought for those who've been following and thinking about it over the last week.

GSS variables used: ETHNIC, RACE(1)(2), RES16(1-2)(3-5)(6), BORN(1), WORDSUM

Thursday, July 26, 2012

IQ estimates from wordsum scores by ancestry

++Addition++The Inductivist points out that over half of those who chose the ethnicity "American" are black (I wonder if this is similarly the case with Census data). I should have suspected something was up with the remarkably low average for those of putatively "Scots-Irish" descent. Shame on me for the sloppiness. The white "American" IQ estimate from wordsum scores is 94.2, on the low end of those of European descent but higher than that of blacks or Mexicans.

---

HBD chickadee has a few bones to pick with Ron Unz about his curious assertion that:
"One very intriguing pattern is that according to Lynn’s IQ data certain European populations such as the South Italians, Irish, Greeks, and South Slavs tended to have IQs much lower than other European populations such as the British and the Dutch. However, according to the Wordsum-IQ data, this pattern is exactly reversed in the United States, with the descendents of immigrants from Southern Italy, Ireland, Greece, and Yugoslavia having much higher IQs than Americans of British or Dutch ancestry."
I'm not at a point where I'm able to read the referenced posting at the moment, so I'm taking the chickadee's word for it. She also chastises Unz for failing to make public the data used to come to the conclusions he comes to. Fortunately, it's easy to tap the GSS for the data Unz presumably used and the chickadee is after, so let's turn the database sideways.

 To avoid issues with language fluency, immaturity, and senility, all respondents were born in the US and aged 25-65 at the time of their participation. All ethnic groups have sample sizes of at least 50, with most far exceeding that minimum threshold (both the ETHNIC and WORDSUM variables have been consistently employed since the survey's inception in the early seventies). Mean wordsum values are converted to mean IQ scores under the assumption that a wordsum value of 6.32 equates to an IQ score of 98 (a reasonable estimate of the US average) with a standard deviation of 15 IQ points:

AncestryIQ
Russian105.2
Austrian104.5
Swiss103.6
Danish102.6
English/Welsh102.4
Norwegian102.1
Hungarian101.6
Scottish101.5
Swedish101.3
Czech100.4
Italian100.4
French100.0
Irish99.7
Polish99.7
Greek99.0
French Canadian98.7
German98.5
Other Canadian96.2
Dutch95.9
Spanish92.4
Native American91.2
African89.9
Puerto Rican89.9
"American"88.7
Mexican87.7

Just a few quick comments. Ashkenazim constitute about half of those of Russian descent. Contrary to Unz' assertion, those of English or Welsh descent outscore Italians, Irish, Greeks, and Slavs, though the Dutch do not. The Scots-Irish highlanders of Appalachia who seem to have forgotten their ancestral homelands fare about as well as blacks do. Black rednecks, anyone? Finally, hardly a novel observation here, but current immigration trends in the US portend a dysgenic future for the US.

GSS variables used: WORDSUM, ETHNIC, AGE(25-65), BORN(1)

Saturday, June 16, 2012

Spoke not a word, though it meant my life

On the question of justice, the contemporary Western world [or Anglosphere, anyway] is collectively more repulsed by a type I error than it is by an error of the second kind, and our judicial system is organized in a way reflecting that. The bar is set high when it comes to demonstrating a person's guilt, the consequences being that people are more likely to go unpunished for committing a crime than they are to be punished for a crime they didn't commit.

But dissent from that societal more is not equally distributed across all groups. On four occasions, the GSS has asked respondents which miscarriage of justice is worse--convicting the innocent or allowing the guilty to go free. Blacks and liberals tilt more heavily in their preference for allowing some guilty people to walk as a cost of ensuring that the innocent aren't convicted (76.3% and 74.9%, respectively, saying that convicting the innocent is worse than letting the guilty off is) than whites and conservatives (71.6% and 70.7%) do.

As Steve Sailer regularly reminds us and the Trayvon Martin case illustrates, though, the "Who? Whom?" question is of paramount importance. In a Florida poll conducted last month, 79% of blacks but only 21% of whites were confident in George Zimmerman's guilt. On the political front, 49% of Democrats and 13% of Republicans asserted that he is guilty of murder. Better lock Zimmerman up to ensure the guilty won't walk!

Getting back to the philosophical, ideological realm, which people hastily evacuate when "Who? Whom?" becomes relevant, it is by intelligence rather than political orientation, sex, or race where divergence in opinion on the question is most pronounced. The percentages of people, by IQ grouping*, who would prefer to see a guilty man let go than an innocent man locked up rather than the other way around:

IQFree
Real dumbs66.0%
Pretty dumbs68.1%
Normals67.0%
Pretty smarts75.3%
Really smarts88.6%

No, dummy, Barabbas' release wasn't the real tragedy!

GSS variables used: VERDICT, WORDSUM, POLVIEWS(1-3)(4)(5-7), RACE

* Respondents are broken up into five categories in a way that approximates a normal distribution; Really Smarts (wordsum score of 9-10, comprising 13% of the population), Pretty Smarts (7-8, 26%), Normals (6, 22%), Pretty Dumbs (4-5, 27%), and Real Dumbs (0-3, 12%).

Monday, June 4, 2012

Education, religiosity, and fecundity

++Addition++Heartiste speculates that differences in the joy children bring people correlates inversely with intelligence, especially among men. On the one hand, there's not much in the way of a relationship between intelligence and fecundity among men, with the pronounced dysgenic trend happening primarily on the female side. Yet my own personal experience is similar to Heartiste's--around children they are unrelated to, the more intelligent a person is, the less he tends to be interested in or care about the kids. Parenthetically, the opposite seems to happen when the objects of attention are pets.

---

Dan poses an interesting question
:
Have you looked at they effect of religiosity on fertility when intelligence is held constant? 
This strikes me as a very important question. It is well-established, I think, that religiosity is positively correlated with fertility. But what is the specific impact of religiosity on the fertility of the really smarts, averages and dumb specifically? 
The significance of intelligence in predicting fecundity vanishes when education is controlled for. In the US, high IQ people have fewer children than those of more modest intelligence do, but it's a consequence of the fact that more intelligent people spend more time in school than less intelligent people do. Smart people who don't go to college have nearly the same fertility rates as dull people who don't, and low IQ folks who pursue post-secondary education don't have more children than high IQ people who do so end up having.

What, though, of the relationship between fecundity and religiosity when educational attainment is taken into account? Before delving into the data, it needs to be noted that the measure of religiosity I'm employing is frequency of attendance at a house of worship, which doesn't necessarily shed light on how fervently or literally respondents adhere to the precepts of their religions or the levels of credulity they display towards their faiths.

Marx's famous labeling of religion as the "opiate of the masses" aside, as Charles Murray points out in Coming Apart, the more intelligent and well-educated people are, the more likely they are to go to church (an assertion that the GSS affirms). At first blush, this may appear to present a conundrum: Religious worship and educational attainment are positively correlated, religious worship and fertility rates are also positively correlated, but educational attainment and fertility rates are negatively correlated. For those of some acquaintance with statistics, of course, we'd only necessarily be trying to square a circle here if all three of the aforementioned correlations were perfect, which they are not.

The following graph shows how religiosity and fecundity are related among those with similar levels of educational attainment. For purposes of contemporary relevance, avoiding racial confounding, and allowing time for family formation to occur, data are from 1990 onward, the respondent pool is limited to whites, and those under the age of 35 are excluded:


At each level of education, the trend is one of religiosity and fecundity moving in the same direction, even as fecundity drops among all cohorts as educational attainment increases. The only irreligious people out-procreating the Russ Johnsons and Inductivists of the world are high school dropouts.

From eyeballing the graph, it is difficult to ascertain whether education or religiosity is the stronger predictor of fertility rates. That's because they're about equally predictive. When it comes to predicting fecundity, the OLS standardized regression coefficients (with IQ included for purposes of reiteration) are as follows:

Educational attainment -- (.19)*
Worship attendance -- .15*
Wordsum score -- .00

* Statistically significant

As far as I'm aware, it appears that educational attainment and religiosity are the two strongest predictors of fecundity in the US (and the rest of the Western world?) today.

GSS variables used: CHILDS, EDUC(0-11)(12)(13-15)(16-17)(18-20), YEAR(1990-2010), BORN(1), RACE(1), AGE(35-89), WORDSUM, ATTEND(0)(1-3)(4-6)(7-8)6370726

++Addition++A reader asks:
What happens to the relationship between church attendance and fertility when you hold wordsum constant instead of education?
That would give the clearest picture of all as to whether religious attendance is eugenic...
Here's the graph:


It looks pretty similar to what we get with the education graph in the body of the post, but the association between fecundity and and religiosity is less pronounced, as the regression coefficients mentioned above predict to be the case.

Saturday, May 26, 2012

Education, IQ, and fertility

Reading some of Inductivist's work on fertility and political orientation among wealthy white women, I was struck by the following:
Education's effect is not the influence of IQ. Among this demographic, IQ is unrelated to fertility. The correlation between IQ and number of kids is .02--basically zero. Education's influence appears to be cultural.
I previously did my best to portray the strong, inverse relationship between educational attainment and fecundity in the US. The correlation is indisputable, but that, of course, does not necessarily inform us about causation. The fear of dysgenic dystopia in the future is usually premised on the notion that IQ, not schooling, and fertility run in opposite directions.

Inductivist's statement made me wonder how much IQ matters once education is taken into account. It's easy to conceptualize why contemporary education and procreation don't mesh well. Young men and women spend their most fertile years accumulating debt and squandering assets (if they have any to begin with). By the time they've graduated, established themselves in their careers, and fixed their personal balance sheets (if they ever manage to do these things, and increasing numbers of them do not), their biological clocks, especially women's, are past noon.

It's more difficult to do the same with intelligence. Popular culture does not particularly celebrate childbearing, but procreation isn't public enemy number one, either. The world-shrinking consequences of technological progress means there are more things than ever for intelligent people to pursue, of which having and raising kids is just one of an ineluctably growing many, and not a seemingly attractive or intellectually 'actualizing' one at that. But total fertility rates in the West were well above replacement for several decades after children had clearly become economic, time-consuming 'burdens' rather than an extra pair of hands to help on the farm. Intelligence and education are linked, often confusedly, in the public mind, but a plausible explanation is that more intelligent people tend to pursue more education, and end up having fewer children as a result.

Using the GSS, let's consider just that. In the following graphs, respondents are categorized into five groups* based on educational attainment and into five groups based on IQ as measured by wordsum scores. For contemporary relevance, only data from the last two decades are considered, and all respondents included are at least 35 years age to allow time for family formation to have occurred.

In the first graph, we see how educational attainment and fecundity relate among those of similar IQ:


So, among those who scored in the 0-3 range on the wordsum test (the real dumbs), those with less than a high school education (black bar), average just over three kids. Those real dumbs who graduated high school (brown bar) and those who spent some time in college without graduating (white bar), average about 2.5 each, the real dumbs with a bachelor's (yellow bar) about 1.75 kids, and those with post-graduate degrees (baby blue bar) 1.5.

For all IQ groupings, education is a strong predictor of fecundity. Even among the really smarts, obtaining a college degree reduces total fertility by 0.5. Among those of modest intelligence, staying in school means staying out of the delivery room. I'm sure there's a cute phrase like "Yale or jail" applicable here, but it's not coming to me at the moment (soliciting suggestions in the comments).


In the second graph, we see how IQ and fecundity relate among those of similar educational attainment:


The relationship here is considerably weaker. The effect of education on average total fertility rates among those of similar IQ is five times as large^ as the effect of IQ on average TFRs is among those of similar educational attainment. This is detectable in the latter graph by noticing how there is a clear decline in fecundity as we move up from one level of educational attainment to the next, but there is not much difference across the IQ spectrum among those of similar educational attainment.

While aware that it is an erroneous oversimplification to argue that the demographic transition in the West has been driven primarily by the increasing duration of formal educational attainment, the latter is strongly associated with the former. The more I look into it, the more difficult it becomes to think about the developed world's inverting age pyramid without considering educational romanticism.

We need methods to speed up the educational process, like self-paced coursework and subject-specific standardized testing (think AP tests for those in college) that allows autodidacts to receive credit as soon as they've demonstrated proficiency in a subject rather than after four inefficient months of spending three hours per week having it delivered to them at varying levels of effectiveness. Ideally, passing the bar would be the only requirement for practicing law and passing the CPA exam the only requirement for becoming a CPA. If this results in a perceived glut of lawyers and accountants, the respective tests can simply be made more difficult. While the relative value of high parental socioeconomic status will decrease and higher conscientiousness might as well, higher intelligence would be rewarded with more precision and young professionals would be able to get to work years earlier and with tens of thousands or hundreds of thousands of dollars less debt on their shoulders.

Necessity being the mother of innovation, here's to hoping the impending popping of the education bubble ushers in changes along these lines.

GSS variables used: AGE(35-89), BORN(1), EDUC(0-11)(12)(13-15)(16-17)(18-20), WORDSUM(0-3)(4-5)(6)(7-8)(9-10), YEAR(1990-2010), CHILDS

* Groups are mutually exclusive, so those who are listed as having graduated high school went exactly that far but no further. Obviously, those who have doctorate degrees also graduated from high school, but they are only represented in the "post-graduate" grouping here.

For IQ, respondents are broken up into five categories that come to roughly resemble a normal distribution; Really Smarts (wordsum score of 9-10, comprising 13% of the population), Pretty Smarts (7-8, 26%), Normals (6, 22%), Pretty Dumbs (4-5, 27%), and Real Dumbs (0-3, 12%).

^ Ordinary least squares standardized regression coefficients are (.16) for educational attainment and (.03) for intelligence as measured by wordsum score. My thanks to Inductivist for walking me through the process of how to determine these.

Wednesday, April 11, 2012

In a forthcoming post, I look separately at the influences of IQ and educational attainment on fertility. I wanted to do something similar with political orientation, so here it is.

The following tables show political orientation percentage distributions by educational attainment after roughly controlling for IQ. Respondents are broken up into five categories, each displayed in a separate table, in a way that approximates a normal distribution; Really Smarts (wordsum score of 9-10, comprising 13% of the population), Pretty Smarts (7-8, 26%), Normals (6, 22%), Pretty Dumbs (4-5, 27%), and Real Dumbs (0-3, 12%). To balance concerns for contemporary relevance with ample sample sizes (specifically among the highly educated, low wordsum-scoring respondents), all data are from 1990 onward. To allow enough time for educational pursuit, respondents are at least 28 years old.

First, those of most modest intelligence:

Real DumbsLibModCon
Less than HS31.935.632.3
High school25.939.135.1
Some college26.834.438.8
Bachelor's32.732.026.9
Post-graduate40.632.526.9

This bunch is pretty consistent across all education levels and a bit to the left of the general population (the total GSS pool is ~25% liberal, ~40% moderate, 35% conservative) with the exception of those at the post-graduate level, where the liberal bent is more pronounced.

Those pursuing doctoral degrees are substantially more left-leaning than their less educated cognitive cohorts all the way up the line. As the professorial class comes from the post-graduate contingent, it's not surprising that college academics are so liberal.

Working our way up that line:

Pretty DumbsLibModCon
Less than HS22.942.734.4
High school20.244.635.2
Some college21.244.034.8
Bachelor's15.740.643.7
Post-graduate31.336.632.2

There is a similar consistency up through the four-year college degree, albeit with a center-right lean instead of a center-left one. Again, at the post-graduate level, liberalism is much more prominent than it is at lower levels of educational attainment.

Among the average Joes:

NormalsLibModCon
Less than HS25.339.435.3
High school21.145.433.6
Some college22.839.737.4
Bachelor's24.731.443.9
Post-graduate26.939.134.2

Just about what would be expected of the middle. The graduate school liberal skew is the most modest here, although it is still detectable.

Moving into the second level of intelligence, educational distinctions become clearer:

Pretty SmartsLibModCon
Less than HS16.642.940.4
High school18.546.335.2
Some college22.438.639.1
Bachelor's26.628.445.0
Post-graduate35.524.939.5

Two-thirds of those with a bachelor's degree or higher come from the pretty smarts and really smarts even though together they constitute a bit less than 40% of the population. Among pretty smarts, the conservative segment doesn't move much one way or the other across the educational spectrum. The changes come among the liberal and moderate columns. As education increases, moderates become liberals. This is intuitive--those who become politically aware during their college years after having been apathetic before that emerge as liberals, but I doubt many committed conservatives shift markedly to the left while in college, especially given how widely the popular right media admonishes conservatives about academia's leftism today.

Finally, the cognitive elite:

Really SmartsLibModCon
Less than HS17.641.441.0
High school26.632.940.6
Some college32.525.841.8
Bachelor's36.523.040.5
Post-graduate47.516.532.3

Again, moderates give way to liberals as we move up the educational ladder, while the conservative contingent holds steady, except at the graduate level. Among the country's most intelligent and educated, moderates are predictably few and far between.

Parenthetically, the impetus for this was a post Razib put together that is a little overwhelming at first (but reading his description and realizing that the table's first section is for all respondents while subsequent sections are broken down as noted makes it comprehensible). Razib's been supportive of TAE and responsive to personal inquiries, even though I'm always vaguely aware that he could rip much of what I write about apart if he wanted to, like he's wont to do to other bloviaters.

How is he propitiated? He tips his hand a bit in said post, describing what he is doing with it:
Instead of talking and commenting I thought as an exercise I would go further, and also be precise about my methodology so that people could replicate it (hint: this is a chance for readers to follow up and figure something out on their own, instead of tossing out an opinion I don’t care about).
If lots of people smarter than myself were moved by his prodding, I'd be out of the job (and they'd be out of a lot free time) and we'd learn a ton in the process!

GSS variables used: YEAR(1990-2010), EDUC(0-11)(12)(13-15)(16-17)(18-20), WORDSUM(0-3)(4-5)(6)(7-8)(9-10), AGE(28-89)

Sunday, January 29, 2012

GSS on drug use and IQ

Inductivist points to a new article in the journal Intelligence that finds that recreational drug use and alcohol consumption correlate positively with intelligence up to a certain point before trending in opposite directions again at the right end of bell curve, the thought being that openness to experience is a personality trait that tends to be associated with higher IQ, and drug use is a way to open oneself up to more novel experiences.

I'm not sure how strong the correlations are or if the relationship holds for some type of alcohol consumption or recreational drug use versus abstention from all of them, or if the correlation holds in varying degrees for alcohol and each drug considered separately (only the abstract is freely accessible). Based on GSS responses and a United Health Foundation report, alcohol consumption and IQ appear to be positively correlated.

Recreational drug usage is a topic for which the GSS contains a relevant question as well, so why not see if it supports what the journal article found? The percentage of respondents who have ever injected illicit drugs by intelligence grouping*. To allow ample time for experimentation to have occurred, only those aged 30 or older are included. For contemporary relevance, all responses are from 2002 or later (n = 9,892):

Intelligence
Injected
Real Dumbs
4.0%
Pretty Dumbs
3.9%
Normals
3.5%
Pretty Smarts
3.2%
Really Smarts
2.3%

This doesn't include smoking weed, the most easily attainable and frequent form of recreational drug use in the US. That said, the modest relationship is, in contrast to the article's finding, inversely correlated with intelligence.

I wonder how important the specific drug in question is to detecting a relationship between usage and intelligence. Presumably crack cocaine users tend to be less intelligent than powdered users are (although as crack is a predominately black drug and powdered cocaine a predominately Hispanic one, neither may correlate positively with intelligence). I'd guess that meth use and intelligence, if anything, trend in opposite directions, as the stereotypical methhead is a rustic white prole of the lowest order. PCP, shrooms, LSD, and ecstasy, on the other hand, are fairly prevalent on college campuses. I know people who use or have used all of them, and they're mostly well-adjusted and intelligent folks. I don't have much of an impression one way or the other when it comes to heroin. The Chinese liked it and it seems pretty popular in Europe, but I'm aware of heroin users who are of cut from the same cloth as methheads, too.

Parenthetically, I've never had even the slightest desire to engage in illicit drug use of any kind. I've associated it with being sickly and desperate for as long as I can remember, and always avoided it without issue even during my formative years. On personality tests, I come up around the 40th percentile on openness, so that bit of built-in protection might help a little, too!

GSS variables used: EVIDU, WORDSUM, AGE(30-89)

* Respondents are broken up into five categories that come to roughly resemble a normal distribution; Really Smarts (wordsum score of 9-10, comprising 13% of the population), Pretty Smarts (7-8, 26%), Normals (6, 22%), Pretty Dumbs (4-5, 27%), and Real Dumbs (0-3, 12%)

Saturday, January 21, 2012

Intelligence and depression

OneSTDV wonders:
There's some controversy over whether higher intelligence and depression correspond. From reading the "intellectual" sphere, generally defined as people who engage in self-analysis, one would surely conclude that such a correlation exists.
Arriving at this conclusion, unfortunately, demonstrates how problematic relying on a few anecdotal data points to arrive at generalized conceptions often is. On top of a prohibitively small sample size, selection bias is also at work here. Robert Lindsay summarizes the relevant scientific literature as follows:
Careful studies have shown that the high IQ basket case is a myth. Studies of very high IQ types have found that in general, as IQ rises, so does mental health. Why this is is not known.
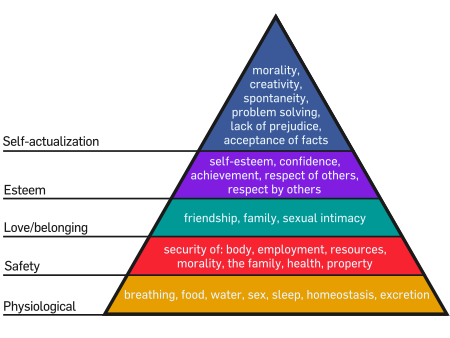
The GSS shows that the least intelligent are the most likely to view life as being devoid of meaning. It's not difficult to imagine why this is the case, whether one employs a Maslow-esque hierarchy of needs where those of modest intelligence tend to be found near the base and the more intelligent closer to the top, or one simply realizes that those on the left end of the bell curve are generally incapable of thinking abstractly.

OneSTDV contrasts "cloudy skies" depression (which might be defined as feeling blue) from the sort of existential depression that a person is susceptible to if he dwells too much on the "relative scale of humanity in the context of our universe". We've seen evidence that argues against the assertion that existential depression and intelligence are correlated. Propitiously, the GSS also provides an item to gauge the more mundane "cloudy skies" depression. Since 2002, it has asked respondents how often they've experienced mental health problems (which include, but are not limited to, depression) over the last 30 day period. The averages (means), by intelligence grouping* (n = 2,537):

Intelligence
Blue days
Real Dumbs
3.7
Pretty Dumbs
3.7
Normals
4.1
Pretty Smarts
3.4
Really Smarts
3.3

Not much variance in the averages here. About the only thing that might be suggested is that higher intelligence may provide a bit of resistance to melancholy.

GSS variables used: WORDSUM(0-3)(4-5)(6)(7-8)(9-10), MNTLHLTH, NIHILISM

* Respondents are broken up into five categories that come to roughly resemble a normal distribution; Really Smarts (wordsum score of 9-10, comprising 13% of the population), Pretty Smarts (7-8, 26%), Normals (6, 22%), Pretty Dumbs (4-5, 27%), and Real Dumbs (0-3, 12%)

Sunday, October 2, 2011

Peace is so SWPL

The Institute for Economics and Peace compiled a peace index ranking the 50 states (see the map here) earlier this year. The index uses five indicators in making the peace score calculations--homicide rates, violent crime rates, incarceration rates, per capita police officers, and the availability of small arms.

At first blush, the last indicator seems to reveal an unsatisfying leftist outlook in the report as less densely populated, politically conservative flyover states tend to have less restrictive legal gun ownership requirements than Northeastern and West Coast states do. That's probably a more-or-less accurate read into the authors of the report. However, gun ownership rates are estimated rather bizarrely by the percentage of suicides in each state committed by the use of a firearm, so while this is surely influenced in some degree by the availability of guns, it's difficult to dispute that a relatively high percentage of people ending their lives by blowing their brains out instead of overdosing on sleeping pills proxies for the violent tendencies of the residents in question reasonably well. Anyway, this factor was assigned the least weight of the five, representing only 1/15th of the peace index total.

Using incarceration rates and the number of police officers per capita is a bit problematic as well. Throwing increasing numbers of people who commit crimes in prison and holding them there is arguably one of the primary reasons criminal activity has decreased in the US over the last couple of decades. Similarly, relatively large police forces could be seen as a necessary response to a violent population, but could also be viewed as an expression--not necessarily related to the actual prevalence of violence--of how high a priority that population makes deterring crime and capturing criminals.

A few years ago, I computed a strictness index that ranked states by how many people they incarcerated relative to the amount of crime that occurred. South Dakota comes out as the most 'draconian'. This is notable because the report contains a "case study" on New York and South Dakota, the former being the state where the peace index has increased the most over the last 20 years and the latter being the state where it has decreased the most over the same period of time. Singling out South Dakota as a state that has slid backwards since 1991 highlights why incarceration rates and police presence are suboptimal measures of peacefulness--homicide and other violent crime rates are almost exactly where were 20 years ago, but because the incarceration rate and the per capita police presence have both increased markedly over that period of time, South Dakota looks bad. As a law-abiding citizen, if more thugs are in jail and more patrol cars are out than they were when I was a kid, but the frequency of crime has been held in check, I'm not complaining too much. These changes are certainly preferable to even a modest uptick in the crime rate.

These qualifications notwithstanding, state-level correlations with indices like these are rarely uninteresting. So without further ado, here are some of them. Positive correlations indicate the variable in question is associated with more peace, negative correlations with less of it:

Mean IQ -- +.62
McCain's share of the '08 vote -- (.31)
McCain's share of the '08 white vote -- (.58)
Median age -- +.28*
White population % -- +.48
Black population % -- (.56)
Hispanic population % -- (.34)
NAM population % -- (.67)
Male:female sex ratio -- +.26*

* Not statistically significant at 95% confidence

The only surprise is in the sex ratio, with relatively more men being modestly correlated with more, not less, tranquility. Crime is a young person's game, so it's hardly shocking that states like Maine and Vermont, where the median age is over 40, are among the nation's least violent.

As always, higher IQ is positively associated with a higher quality of life. And also as always, ugly a fact as it is, the more black and Hispanic a place is, the lower that place's quality of life tends to be.

Although the report, at 52 pages in length, delves deep in discussing the results and implications of the index, and the racial composition of a state is apparently the single most determinative factor in how that state fares, there is not a single mention of race in the entire thing. Those of us interested in human biodiversity are often accused of being obsessed with racial differences. Well, race matters. It matter a lot. Reports like this, in which the most influential variable is inexplicably ignored, illustrate that rather than HBDers being excessively focused on race, the majority of people are tragically ignorant of it (or at least profess to be so) whenever paying attention risks casting non-whites in a bad light.

It's plausible to think that in places where crime is an acute problem, whites react by tending towards political candidates, generally Republican, who take a tough-on-crime approach, and that is reflected in the strong inverse correlation between peace and the percentage of whites who voted for McCain. Whites in the South vote heavily Republican--at rates in Alabama and Mississippi that nearly mirror black support everywhere else for whoever the Democratic candidate is--and the South, unsurprisingly, is rated the least peaceful in the country.

Saturday, August 20, 2011

Who believes in the power of hard work?

Advances in gene sequencing and brain scanning technologies are continually threatening the human notion of free will, and the smart money appears to be on us coming to the uncomfortable realization that we have a lot less control over our actions, behaviors, and abilities than we think we do, sooner rather than later.


That said, it's encouraging to find that over two-thirds of Americans, when questioned on what it takes to get ahead, assert that hard work is more important than are lucky circumstances or getting help from others. At the individual level, the belief in the efficacy of personal effort is a benefit, a beneficent lie to the extent that it is overemphasized. What good does it do for someone of limited ability and prospects to languish in self-pity or resentment, resigning himself to a dismal, effortless existence because he knows the game is fixed, and so what's the point in trying?


There are inherent dangers in believing effort is everything, especially for those who have won life's lottery. If someone of nearly limitless potential decides to coast on his early accomplishments, having attained a bachelor's degree from State U and currently making $80,000 a year in a comfortable job, reasoning that "Hey, I'm doing better than most people, and that's pretty good, right?", the world is the poorer for it. More pithily, if accomplishments are exclusively the products of personal effort, the venerable words from Luke--that "from everyone who has been given much, much will be demanded; and from the one who has been entrusted with much, much more will be asked"--lose much of their meaning.


There is also the problem of people having unrealistic expectations about success, the idea that any child is capable of becoming an astronaut or the future president of the US, as NCLB illustrates. But a more pressing concern to me seems to be the sense of entitlement that has infected Western civilization, the sense that everyone deserves a prestigious, fun existence and lots of material accouterments to accompany it without having to do much of anything to earn them.


The declaration that two-in-three Americans believe hard work is paramount in getting ahead in life comes from a GSS question that reads "Some people say that people get ahead by their own hard work; others say that lucky breaks of help from other people are more important. Which do you think is most important?" The three possible answers are "hard work", "both equally", and "luck or help". It's a question that is posed to a huge swath of participants, so sample sizes are large across the board. The following table shows a self-determination index (SDI) score, computed by taking the percentage of respondents who say hard work is more important and subtracting from it the percentage of respondents who say "luck or help" is more important. For contemporary relevance, all responses are from 2000 onward:


Group

SDI

Race


Whites

58.4

Blacks

47.7

Native Americans

61.6

Asians

51.9

Hispanics

62.2

IQ


Really smarts

54.1

Pretty smarts

54.8

Normals

62.3

Pretty Dumbs

56.4

Real Dumbs

59.4

Age


18-29

60.0

30-44

57.8

45-64

55.5

65+

53.0

Political orientation


Liberal

49.7

Moderate

56.1

Conservative

64.3

Partisan affiliation


Democrat

54.6

Independent

54.5

Republican

62.9

Sex


Male

54.0

Female

59.2

Birthplace


US native

56.8

Foreign-born

56.0

Theism


Atheist

45.5

Agnostic

42.4

Uncertain believer

52.0

Firm believer

60.9

Educational attainment


Less than high school

59.9

High school grad

58.0

Some college

55.8

Bachelor's degree

55.2

Post-secondary work

52.5


The largest differences are racial, political, and theological. Intelligence, educational attainment (though the academic world's emphasis on the powerlessness of the individual and the heavy influence of societal forces beyond the individual's control shouldn't be discounted in the observation that those with less education put more emphasis on the value of hard work than those with more education do), sex, age, and whether or not you were born in the country do not factor in much.


I'm not surprised to find that blacks, many of whom are enmeshed in the idea that white society is forever holding them down, and Asians, who despite doing well, seem strangely fascinated by luck or the lack thereof, take a more cynical view of the value of hard work than whites do. That Hispanics and Native Americans actually believe in the importance of effort a little more than whites do is more unexpected. To offer an explanation after the fact, Amerindians have lower levels of self-esteem and are less braggadocios than blacks and whites are, so perhaps they're more willing to accept the fact that while hard work is helpful, they don't always possess the will to work very hard themselves.


The political shake out is predictable. Liberals and Democrats are more inclined towards the idea that people are a product of societal forces beyond their control and consequently there is a need for a powerful central government to right societal wrongs and redistribute wealth in an equitable manner. Conservatives and Republicans are closer to the Ron Paul message of individual liberty and personal responsibility, viewing government as a nefarious force that punishes the innocent and rewards the guilty.


Somewhat ironically, those who believe in God are more likely to feel that it's up to oneself to make it in the world, even as they pray for blessings and assistance from above, while atheists and agnostics feel that a person has relatively little control over his circumstances in life.


Parenthetically, the slight increase in the belief in hard work among the young tracks with the gentle trend over the four decades that the GSS has asked the question for people to increasingly respond that hard work more than luck is more important in determining whether or not a person gets ahead in life.


GSS variables used: GETAHEAD(1-3), YEAR(2000-2010), SEX, RACECEN1(1)(2)(3)(4-10)(15-16), GOD(1)(2)(3-5)(6), POLVIEWS(1-2)(3-5)(6-7), PARTYID(0-1)(2-4)(5-6), BORN, WORDSUM(see *), EDUC(0-11)(12)(13-15)(16-17)(18-20)


* Respondents are broken up into five categories; Really Smarts (wordsum score of 9-10, comprising 13% of the population), Pretty Smarts (7-8, 26%), Normals (6, 22%), Pretty Dumbs (4-5, 27%), and Real Dumbs (0-3, 12%)

ban nha mat pho ha noi bán nhà mặt phố hà nội