RSS
Facebook
Twitter

Showing posts with label The states. Show all posts

Sunday, January 5, 2014

Pat Buchanan would get it

Randall Parker on the benefits of a higher minimum wage and his support for Ron Unz' California initiative:
The public health benefit: Since fast foods are harmful higher prices will discourage people from eating them. 
Smaller welfare state: People who make more money will qualify for fewer social welfare programs. We net taxpayers will save money. The Gray Lady's article actually mentioned this benefit. 
The immigration benefit: The average skill level of immigrants will go up when the supply of low skilled jobs suitable for low skilled immigrants gets radically curtailed by high prices. 
The innovation benefit: High prices for labor are a great incentive for innovation. Look at what manufacturing unions did to boost investments in equipment that raises productivity. 
Cheaper restaurants in the long run: The automation of food preparation will ultimately lead to cheaper restaurants (so, yes, the public health benefit will be transitory).
When I was in college, I used to unctuously argue that red state governments should ditch the trickle down argument and instead capitulate, admitting they are unable--and their constituents unwilling--to give the poor and downtrodden the legs up they need. Instead, they should use the meager funds they were squandering on such attempts to transport their impoverished populations to blue states where they could be more adequately coddled. It's how someone with a distinctly middle class background morally postures while simultaneously trying to demonstrate independent thought, which I naively thought at the time was something the college atmosphere was actually designed to foster. It made for decent undergraduate discussions at a state university, anyway!

Randall's support for the minimum wage is a variant on that thinking, and unlike urging red states to gift wrap their huddled masses and ship them to the coasts, his idea is practicable. Randall mentions some other western states that allow for ballot initiatives like California does. In addition to the golden state, he mentions Arizona, Oregon, and, worst of all, Colorado. If he had his way, lots more terminally poor immigrants would find low cost-of-living Kansas a reasonable destination. Zip it, Randy!

Contemporary political alignments in the US are such that there isn't one party that backs a bunch of policies that all have the real-world consequences of increasing (or decreasing) the total levels of human capital in the locales that adopt them, or at least not clearly so (ie, the left's support for environmental and other zoning restrictions on commercial and residential construction on one hand and its support for affirmative action hiring practices on the other, etc).

High minimum wages discourage illegal immigration because they negate the the major advantage illegals offer. If slavery still existed as an institution in the US, a mandated minimum wage would, principally, similarly damage it. What it didn't wipe out, it would at least push it underground. Indeed, an almost certain consequence of Ron Unz' initiative, if passed, will be an expansion in the size of the cash (or, more aptly referred to, underground) economy. It's an example of a putatively leftist cause that has the effect of increasing human capital.

Welfare benefits, on the other hand, encourage illegal immigration. This is still one of the biggest issues the left pushes (and the mainstream right opposes) and it has an effect on human capital opposite of what hiking the minimum wage has.

The traditional right needs to get behind artificially pushing up the wage floor while maintaining opposition to increases in social spending. A state that adopted this seemingly 'contradictory' set of policy initiatives, especially one with a large illegal immigrant population (Arizona being the most plausible trailblazer, as it has a heroic recent history when it comes to combating foreign settlement within its borders) could really see an exodus in illegal immigrants from said state as a consequence.

Saturday, December 14, 2013

From PISA, some gaps more equal than others

A few leftover observations from the 2012 PISA results that I haven't seen widely remarked upon elsewhere follow.

- Excluding DC's affluent white minority, according to NAEP testing results, Massachusetts boasts the most intelligent kids in the United States. That holds among states' entire public student body and also for states' non-Hispanic white student populations. It's the best we have to offer.

As a whole, in mathematics the Bay State comes in tied with Germany and beats Austria, Australia, Ireland, Slovenia, Denmark, New Zealand, the Czech Republic, France, the UK, Iceland, Latvia, Luxembourg, Norway, Portugal, Italy, Spain, Russia, Lithuania, Sweden, Hungary, Croatia, Greece, and Serbia among the  participating members of the Occidental club. It comes in behind Belgium, Poland, Canada, Finland, Estonia, the Netherlands, Switzerland, and Liechtenstein. Somewhere in the top third or so of the Euro-descended pack is hardly something to to be ashamed of.

Even Massachusetts, of course, can't match any of the East Asian countries save for descriptively ambiguous Vietnam (though Massachusetts' Asian population outscores all of East Asia except for Shanghai and Singapore--it beats Hong Kong, Taipei, South Korea, Macau, and Japan).

- Being a parochial provincial, I'm unaware of whether or not the female aversion to the STEM fields has yet reached crisis mode outside the US as it has within. Here in the states it's the second biggest problem in education (the intractable Gap forever remaining the ultimate behemoth--why, as Arne Duncan is surely aware, if only we could close the Gap, we'd shoot back into the thick of the European pack. Having closed the national Gap, we'd then be able to move on to the international Gap, snapping it shut and at last putting Liberia on equal footing with Latvia!).

If the issue doesn't have as much visibility outside the US as does within, it's not for a lack of data pointing to the problem. Teenage boys outscored their fellow female students in 51 of the 68 places where testing was administered. In four of the 68, there was no difference in male and female performance. These egalitarian paradises include Kazakhstan, Cyprus, Lithuania, and Montenegro.

Even more equal than that, though, are the countries where the girls outperformed the boys. First, the suggestive female advantages, although the sex differences do not reach the level of statistical significance at a 95% confidence rate--Albania, Russia, Bulgaria, Sweden, Finland, Singapore, Latvia, and the United Arab Emirates. Five of the 68 places are genuinely able to celebrate gender equality by pointing to statistically significant advantages among their female students over their male counterparts. These nations are Iceland, Malaysia, Thailand, Qatar, and Jordan. Looks like the only country more progressive than Qatar when it comes to women's rights is Jordan! Who knew?

Staffan mentioned sour grapes in the context of Denmark's questioning of the validity of the latest PISA results, but the Danes have a lot more to be proud of than the Chinese do. Sure, the latter may be earning higher marks on the scholastic tests, but the when it comes to the results that really matter--those measuring equality--Denmark kicks Shanghai's ass!

- Parenthetically, there is a gender gap that is more overwhelming and consistent than the one in mathematics, but it's not a problem to get worked up about. This gap actually indicates the utmost triumph of Equality--in every single pedagogical jurisdiction, all 68 out of 68 of them--girls outperformed boys in reading, and at statistically significant levels across the board to boot. Once again the two countries with the largest female advantages are Qatar and Jordan!

- Finally, how about a little curmudgeon's revenge? There really is no such thing as a free lunch:


Saturday, September 14, 2013

Randall Parker points to a CNBC article focused on unfunded pension liabilities at the state level that is packed with quite a bit of data on the financial condition of the fifty. I've been after something like this for several years.

There are multiple ways to view the numbers, but probably the most broadly informative involves adding together current state debt and unfunded pension liabilities going forward and then looking at these on a per capita basis. That is, determine the dollars each resident of a state is putatively on the hook for at present to pay what the state currently owes and will expect to additionally owe beyond its projected funds on hand. Of course, debt can be defaulted on and promises reneged--realistically, that, in tandem with some combination of currency devaluation, is my best guess for how this unsustainable situation eventually resolves itself, with varying levels of disruption at varying times in the future.

The following table shows per capita debt-plus-future-obligations ("debt" going forward), with the financially healthiest states at the top of the list and the least solvent states at the bottom:

StatePerCap$
1. South Dakota513
2. Tennessee847
3. Idaho969
4. Nebraska1,046
5. North Carolina1,138
6. Texas1,514
7. Wyoming1,982
8. Wisconsin1,982
9. Iowa2,296
10. Florida2,320
11. Missouri2,426
12. Georgia2,436
13. Vermont2,688
14. Arkansas2,695
15. Indiana2,707
16. North Dakota2,726
17. Maine2,756
18. Utah2,785
19. Arizona2,939
20. Washington2,961
21. Oklahoma3,237
22. Delaware3,265
23. South Carolina3,487
24. Michigan3,535
25. New York3,548
26. Minnesota3,606
27. Alabama3,746
28. New Hampshire3,762
29. Virginia4,035
30. Montana4,042
31. West Virginia4,223
32. Pennsylvania4,284
33. Kansas4,402
34. Oregon4,611
35. Nevada4,801
36. Maryland4,864
37. Colorado4,996
38. Louisiana5,205
39. California5,650
40. Mississippi5,882
41. Rhode Island5,901
42. New Mexico6,554
43. Ohio7,025
44. Kentucky7,322
45. Massachusetts7,455
46. New Jersey8,480
47. Illinois9,056
48. Hawaii9,878
49. Connecticut10,776
50. Alaska12,363

A visualization of the data with figures is available here, and is reproduced without interaction below:


No blatant trends jump out. Sparsely populated, mostly white flyover states in close proximity of Canada tend to be in the best shape, with the major exception of Alaska. Thank goodness for that petroleum dividend--suspend payouts for a decade or so and the problem is solved!

Illinois, the nation's most demographically representative state, similarly serves as one of the states that comes closest to serving as a microcosm for the nation as a whole, though even it comes up well short. While Illinois' residents are looking at a little north of $9,000 in debt peonage per, these state-level obligations pale in comparison to the debts and empty promises of the federal government, for which debt alone is currently running over $50,000 per person.

The article opens by attributing Detroit's municipal bankruptcy to "underfunded retirement promises to public sector workers". Tautologically so, but no doubt haters have made attributions of their own that are hatefully racist and racially hateful. The correlation between a state's Ice People (non-Hispanic white + Asian) population percentage and its debt is an inverse .21. It runs in the direction haters expect it to run in, though it's a tepid relationship.

How about something to Sean Hannity's taste? The correlation between debt and Obama's share of the 2012 presidential vote is a more robust .39. Blue states really do tend to be less fiscally responsible than red states even though blue states generally have more human capital to work with.

Speaking of human capital, the inverse correlation between debt and estimated state IQ is a statistically insignificant .06. The relationship between median age and debt is more feeble still, at .03. It might be nice to think that the states that have the most time to formulate viable solutions before the bills start coming due en masse are the ones who need that time the most, but alas it isn't so.

In addition to having, on average, modestly less intelligent populations than blue states, red states also tend to be fatter. In light (heh) of the above, then, it comes as little surprise that debt and obesity inversely correlate at .23. In this case, it looks like it's possible to have your cake and eat it, too--those public service health campaigns in Connecticut aren't doing the nutmeg state's bottom line any good!

Parenthetically, as a supporter of full Puerto Rican independence, I can now point to the fact that the island's per capita debt, at $12,487, is higher than that of any state in the union. While Puerto Ricans may not be as affluent as Americans, they're even better at spending money they don't have than we are. Really, what do they need us for?

Thursday, September 5, 2013

NAEP scores and demographics galore

Previously, this provincial took a look at the relationship between scholastic performance and student body racial composition for the two most populous counties on the Kansas side of the KCMO metro area. Let's do the same but this time at the national level, replacing individual schools with states and using data from the National Assessment of Educational Progress (NAEP).

The y-axis shows the percentages of each state's public school student bodies that are either non-Hispanic white or Asian (Ice students). The x-axis shows the amalgamated math and reading section scores from the 8th grade NAEP, administered in 2011:


The correlation between Ice student body percentage and combined math and reading scores is a positive .64 (p = .0000003). That's a pretty strong relationship for the social sciences, though it is not as nearly perfectly rigorous as the two-county correlation of .93 is. That's hardly surprising--the differences between the white population of Massachusetts and the white population of West Virginia are more numerous and more substantial than are the differences between the white populations of Olathe and Overland Park.

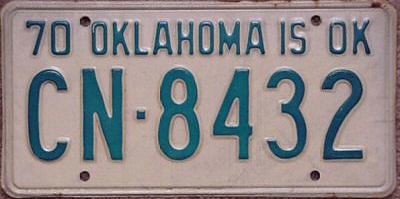
The farther below the green linear trend line a state falls, the 'better' it is performing relative to what the racial composition of its student body alone would predict. Conversely, the higher above the trend line a state floats, the 'worse' it is doing relative to what race alone would predict. West Virginia, predictably, looks awful. Evidence of the "Texas miracle" is manifest as well. Older Okie license plates hearken back to a time when average was, well, average, rather than an affront to a thing's dignity and self esteem. They read: Oklahoma is Ok. Indeed it is. Broadly speaking, the South puts on sub-par performances while the mid-Atlantic looks pretty good. Not a shocker to people who've read Albion's Seed. Perhaps less predictably, however, is the fact that with the exception of the sterling state of Massachusetts, New England is rather underwhelming.

Racial classification--being the broad, fuzzy concept that it is--isn't definitive, of course. Other disparate considerations like population density, culture, socioeconomic status, geography, ethnicity--hell, maybe even teaching tactics and classroom size--influence testing results. If race was everything, the correlation would be a perfect 1.0. That said, race is definitely predictive, and consequently it matters quite a bit.

Tangentially, interpreting the entrails of this graph, allow me to audaciously play augur and predict that within a generation, Texas, Arizona, Florida, Georgia, Louisiana, and, most boldly, Mississippi, will all be irretrievably lost to the GOP and will have become reliably blue states--final nails in the coffin of a moribund Republican party, unless it is somehow able to win over upper Midwest states like Minnesota, Iowa, Wisconsin, Michigan, Ohio, and Pennsylvania as compensation in the interim. I'm not putting my money on it.

Tuesday, June 18, 2013

The obese eat weight loss up

Obesity rates by state:


And google search indices for "weight loss" by the same:


The correlation between the two is a rigorous .77 (p = .00*), a remarkably strong relationship for such a measurement, and at the state level to boot.

Candy man tempting the thoughts of a sweet tooth tortured by weight loss--well, at least it's not for a lack of trying. Or a lack of expressing at least a passing internet interest, anyway. Or even an excess of intelligence. If nothing else, they have the Dream.

Advice gleaned from a longitudinal study with a sample size of one: Cut the carbs, especially sugars and anything wheat-based, then eat to satiation without counting calories, points, or gil. Lift heavy things, and not just with the chest and biceps--get everything involved. Everything. Drink lots of water and don't drink much of anything else. Get seven hours of sleep a night. Have sex three or four times a week (really, moderation is golden here).

* 5.01^-11, more precisely.

Monday, June 17, 2013

Hey Zeus, meet Jesus

Forget the bible belt, now we've got the Jesus belt:


From the blurb at BabyNameWizard, "unlike most Christians, who decline to use the name Jesus out of respect, Christians in the Spanish-speaking world commonly bestow it to bring the bearer under the special protection of the son of God."

Thursday, May 30, 2013

Mexico vs. Israel

This match will determine which nation is the greatest on earth!

Repeating a point he's made on several occasions, Steve Sailer recently noted:
Mexico gets relatively little coverage in the United States English-language media despite its immense importance to the future of our country.
To assert that the major media are entirely ideologically driven without regard to consumer demand would be hyperbolic, but when it comes to the seemingly inordinate amount of coverage given to a small country on the other side of the Atlantic with fewer people in it than Virginia has relative to the amount of focus given to a country we share a border nearly 2,000 miles long with and that has a population three times that of California (and 14 times Virginia's), supply isn't adequately addressing demand.

The most recent Google Trends data shows that for every search in the US including the term "israel", there are nearly four searches including "mexico" (with searches containing the word "new" excluded to avoid counting the US state in the country of Mexico's column).

There are, not surprisingly, large geographic variations in search interests. New York leads all states (plus DC) in conducting the highest percentage of searches including "israel" in them (as does New York City when cities are evaluated instead of states), while California leads the pack in the percentage of searches containing "mexico" (sans "new"), followed closely by Texas and Arizona.

What do The New York Times, The Wall Street Journal, Fox News, ABC, NBC, CBS, and countless other major media outlets have in common? Why, headquarters in NYC, of course. Parenthetically, the nation's capital, home to NPR and The Washington Post, comes in fifth among states in terms of the percentage of searches originating there that include "israel" in them.

The following table ranks the states by their 'favoritism' towards Israel over Mexico in terms of percentages of Google searches that include either of the words in them, comprised by simply taking the "israel" search index number and subtracting the "mexico" search index number from it. The index figures used are on a 100 point scale for each term individually, with the most interested state setting the top value of 100 and the figures for the other 50 states being calculated in reference to the top search state in both cases separately. Consequently, even in Massachusetts, the most 'pro-Israel' state, searches including "mexico" still outnumber searches including "israel" in absolute terms. Search data are not case sensitive:

StateIS-MX
1. Massachusetts+63
2. New York+53
3. Maryland+28
4. New Jersey+26
5. District of Columbia+23
6. Connecticut+17
6. New Hampshire+17
8. Pennsylvania+16
9. Rhode Island+13
10. Hawaii+12
11. Maine+8
12. West Virginia+7
13. Florida+5
14. Ohio+3
15. Alabama+2
15. Delaware+2
15. South Carolina+2
18. Tennessee+1
19. Vermont0
20. Kentucky(1)
20. Oklahoma(1)
22. Montana(2)
22. North Carolina(2)
24. Alaska(3)
24. Mississippi(3)
26. Georgia(4)
27. North Dakota(5)
28. Louisiana(6)
29. Indiana(7)
29. South Dakota(7)
31. Arkansas(11)
31. Iowa(11)
31. Kansas(11)
34. Michigan(12)
34. Washington(12)
36. Missouri(13)
36. Nebraska(13)
38. Idaho(14)
38. Minnesota(14)
38. Oregon(14)
41. Illinois(16)
41. Wisconsin(16)
41. Wyoming(16)
44. Utah(18)
45. Colorado(24)
46. Nevada(29)
47. New Mexico(34)
48. Virginia(38)
49. Arizona(47)
50. California(48)
51. Texas(54)

A visualization of the data is available here.

The Virginia data may be corrupted, but I don't want to arbitrarily dismiss them outright without good reason. There are no metro areas in which the "mexico" index score is anywhere close to the state's total, while the city of Sterling, home to Dulles but fewer than 30,000 residents, comes in at the top spot for all cities in the entire country when it comes to looking up Mexico.

Excepting the Virginia anomaly, the geographic differences are stark. The Northeast, and especially the media establishments therein, are far more interested in their brethren--what? No, no, I meant that in a brotherhood of mankind kind of way, no ethnic insinuations from me!--than the rest of the country is, while the Southwest shows an unbecoming amount of interest in our neighbors to the south.


Wednesday, May 15, 2013

Fruitcakes and fertility

The correlation between the percentage of a state's population that identifies as LGBT and its fertility rate is an inverse .31 (p = .03). This modest relationship means that one-tenth of a state's fertility rate is 'attributable' to the proportional size of its LGBT population. Conjecturing irresponsibly, with about 3.5% of the population identifying as LGBT nationally, let's say one-third of that 10% queer push comes from the gays themselves and the other two-thirds comes from the environments they prefer and help create which are not especially conducive to procreative family formation.

Saturday, April 6, 2013

Cali Shore

Steve highlighted a NYT article on the increasing acceptance of illegal immigration in the state of California over the last couple of decades. That acceptance was coerced of course, as Californians peaceably tried, through the democratic process, to halt the transformation of their state by supporting proposition 187 in 1994 only to have it subsequently ruled unconstitutional in federal court. Thus the transformation continued, the most conspicuous consequence being that the golden state--which voted for Bush 41 in 1988--has become a permanent Democratic stronghold, one in which no Republican presidential candidate would dream of wasting time campaigning in.

I wondered how else the state's profile had changed relative to the rest of the country over the same period of time, so I dug up data on three conventional quality-of-life measures: Obesity rates, NAEP scores, and poverty rates. Diversity being strength, presumably things should be getting better for California on these measures!

On the fat front, indeed they are (or more accurately, corpulence isn't increasingly as rapidly in California as it is in the rest of the country)--in 1991, California was tied for the 10th slimmest 'state' (including DC) out of the 48 for which there were data. By 2011, it had upped its rep count to 6th slimmest of the same 48. Middle class white flight might have something to do with this, as native Californians who've remained have better SWPL credentials than the ones who've left do. Whatever the reasons, Cali continues to be as health-conscious as ever.

When it comes to scholastic achievement, though, things don't look so swole. Among 8th graders taking the math section of the NAEP in 1990, California's kids came in tied for 29th of 38 states. By 2011, they just had the Deep South and DC between them and the bottom of the barrel, coming in tied for 34th of the same 38 states. Alabama's motto is still "Thank God for Mississippi", but that may well soon change to "Thank God for California".

Twenty years ago, California's economic situation mirrored that of the nation as a whole. The state ranked 27th of 51 in the percentage of its population that was impoverished (the lower the ranking, the higher the poverty rate). Today, it's 35th of 51.

Healthier, intellectually incurious, and poorer--yep, that seems to capture the nation's contemporary transitioning, from sea to shining sea.

Saturday, March 2, 2013

Pugilistic pit bulls

Roissy's perspicacious, if deliberately provocative (it's who he is, after all), post on pit bulls and the bleeding heart SWPL instinct to apologize for (if Tookie was a dog, he'd look like this) and adopt them got me into a heated facebook conversation. Opposition to Roissy's post took two familiar forms; 1) Exceptions to the rule ("My family's three year old pit bull is the most lovable dog ever."), and 2) External factors ("It's all about how they are socialized and raised. Any dog can be made vicious by an irresponsible owner. Rottweilers and German Shepherds used to be thought of as the most dangerous dogs, now pit bulls are.").

Different breeds of dogs do not all share the same propensity for violent behavior. Statistics show that pit bulls kill more people than does every other kind of breed of dog combined. Yes, part of that is a consequence of the way pit bulls are often raised, but the reason they're raised to be fighters is because they are the breed most naturally suited to fight. Even if, for sake of argument, propensity for violence is assumed to be identical across breeds, when a pit bull snaps, it can very well be lethal. When a dachshund does, it's essentially harmless and just sort of funny. Further, pit bulls notoriously give little or no warning prior to attacking, unlike virtually all other dog breeds, which bark, growl, and assess their targets before lunging.

Humans aren't great at thinking in terms of probabilities. Of course most pit bulls are not going to seriously injury people (or other dogs)--the nice pit bull story isn't even the exception that proves the rule, because it's more the rule than it is the exception, but the fact remains that though they are in an absolute sense unlikely to injure or kill people, they are more likely to do it than any other breed is, by a long shot. In absolute numbers, Rottweilers are the second most lethal dog breed, and huskies (or wolf-dogs, depending on how prevalent the incorrect identification of wolf-dogs as huskies is) are third.

Regarding irresponsible owners, there are reasons certain animals are outlawed in most cities. Take tigers as an extreme example. Blaming a tiger's reckless owner after it rips my face off doesn't change the fact that my face has been ripped off. If that same irresponsible owner had a pug instead, I'd be just fine. There exists a spectrum, and pit bulls are as far to the dangerous end of the spectrum as dogs get.

The assertion that pit bulls are the new rottweilers or new German shepherds is difficult to square with the fact that the former breed is (and appears to have been for as long as records have been kept) considerably less common than the latter two breeds are. According to the American Kennel Club, in 2012 German Shepherds were the second most widely owned breed, Rottweilers were ninth, and pit bulls were 76th. These stats rely on registration data, and presumably pit bull owners (present company of SWPLs who are the target of Roissy's derision excluded) tend not to be the types of people who do civically-minded things like registering a pet, obeying federal drug laws, or joining the PTA. Still, it is clear that despite being less common than other potentially dangerous dogs, pit bulls cause a lot more absolute harm than other problematic breeds do.

The same sort of thinking that makes people jump to the defense of pit bulls is the sort of thinking that leads them to defend hip hop culture, oppose racial profiling, support open borders, etc.

Allow me to excerpt one of Roissy's many golden lines:
Not content with leaving ill-bred animals alone, and apparently incapable of enjoying the simple pleasure of normal dogs like labs without experiencing an existential crisis, the pitbull has become the newest cause celebre for urban SWPLs who can’t make it through a day without a pat on the back from their fellow missionaries.
For fun, I took a gander at Google trends' results for the terms "labradors" and "pitbulls" (understanding that the compound word should actually be two separate words, but also aware of the fact that "pitbulls" is more commonly searched on than is "pit bulls", and cognizant that the 'musician' who uses the singular form of the word requires that both terms be searched on in the plural) by state. The following table ranks states by labrador preference, which is calculated by simply taking a state's search index (on a relative scale from 0-100, the higher the number the more frequent the search term is) for labradors and subtracting from it the state's search index for pitbulls:

StateLabs
1. New Hampshire69
2. Montana67
3. Maine62
4. Alaska59
5. South Dakota54
6. Vermont47
7. Connecticut46
8. Idaho36
8. Oregon36
10. Massachusetts34
10. North Dakota34
10. Wyoming34
13. Wisconsin33
14. Colorado31
15. Iowa29
16. Minnesota28
16. Washington28
18. Rhode Island27
19. Pennsylvania23
20. Maryland18
21. Nebraska17
21. Ohio17
23. New Jersey16
24. Missouri14
25. Utah13
26. Kansas8
27. Virginia8
28. New York5
29. West Virginia5
30. Delaware4
30. Oklahoma4
32. Michigan1
33. California0
34. Indiana(1)
35. Kentucky(3)
36. Arizona(5)
36. Illinois(5)
36. New Mexico(5)
36. Tennessee(5)
40. Nevada(6)
41. Hawaii(8)
42. North Carolina(11)
43. Arkansas(14)
44. Florida(15)
45. South Carolina(19)
46. Alabama(20)
47. Georgia(29)
47. Texas(29)
49. Lousiana(42)
50. Mississippi(56)

A cartographical representation is available here. Head north for civilization, south for barbarism.

Weather aside, this ranking could almost double for a listing of the nation's nicest places to live in. The correlations between a state's estimated average IQ and its labrador preference is .77 (p less than .01) and between a state's homicide rate and its labrador preference is an inverse .72 (p less than .01).

Monday, February 4, 2013

The windy city is to die for

Reading through the comments at Randall Parker's Parapundit, I see the proprietor himself musing on murder, specifically Illinois' high rate of unsolved homicides:
I would have expected the rest of Illinois (55.4%) to dilute the state-level effects of Chicago. But no.
In 2009, the most recent year for which I've gathered detailed homicide data from the FBI's Uniform Crime Reports, the entire state of Illinois logged 477 non-negligent murders. That same year, the city of Chicago alone recorded 459. Over 96% of the state's killing takes place in a city that holds around one-quarter (depending on the city proper is counted) of its total population.

Wow. This is presumably an extreme but informative example of how urban/rural differences are probably a lot more important when it comes to determining violent crime rates than state-to-state differences are.

Saturday, February 2, 2013

IQ and homicide

The inverse correlation between mean white IQ (as estimated by NAEP scores) and the white homicide offender rate at the state level in the US is a statistically significant .67 (p = 0).

A few technical notes: Florida is excluded for lack of adequate FBI uniform crime reporting data. "White" includes Hispanics who racially identify as white. To compute the total white NAEP scores for each state, I took NAEP results for 8th graders from 2005 and then weighted the non-Hispanic white and Hispanic scores according to how much of the total white test-taking population each comprised. For the states in which the Hispanic population is too small to be reliably reported, I used the average Hispanic score from the states where the Hispanic populations are large enough for mean scores to be reported.

Intelligence doesn't just improve quality of life measures in a cerebral way, it also does the physical body good.

Wednesday, January 30, 2013

Arie Peliger is a charlatan

Out of our most renowned, prestigious military academy's Combating Terrorism Center comes a report entitled "Challengers from the Sidelines: Understanding America's Violent Far-Right". At nearly 150 pages, it was difficult enough to hastily skim through, let alone read it from top to bottom. Sample sentence: "The far right has become more vibrant and more ideologically and structurally diverse than ever before." (Wait, is that a good thing?)

I'd like, however, to highlight the jaw-dropping statistical analysis the distinguished author, one Arie Perliger, offers. Jumping to page 96, we're presented with a table ranking states by the number of "far-right attacks" that have occurred in each over the last two decades. Subsequent correlations are then reported. The four variables for which the relationship with the number of attacks in a state are the strongest are Jewish population size (r = .900), state population size (r = .888), Hispanic population size (r = .849), and African American population size (r = .598). By "size", Perliger is simply referring to population and is thus not talking about attacks per capita. The reason California has suffered so many more attacks than Wyoming has  suffered (782 versus 6) is because California has so many more people--Jews, blacks, and Hispanics among them--than Wyoming has! I'm not making this up. Take a look for yourself.

Employing this 'methodology' (that would embarrass a freshman in the second week of Statistics 101), Perliger notes that "the birthplace of groups such as the KKK ... is no longer that natural habitat of the far right. ... The two states at the top of the list are California and New York, which are considered liberal--or blue--in terms of their ideological and political orientation. ... It can be determined that during the last twenty years the violence has shifted from the center/South to the coasts and the North (with the exception of Texas)."

To legitimately talk about a shift over time, Perliger would need to include a dataset from the past to compare to the present, which he doesn't do. That is parenthetical to the fatal flaw underlying his analysis, though. He is essentially putting together a ranking of states by population size, using it as a proxy for far-right violence, and then cobbling together something of a historical narrative about geographic shifts and trends in said far-right violence over time. By Perliger's thinking, if North Dakota and South Dakota combined into a single state, the new state, Greater Dakota, would be twice as susceptible to far-right violence as either state was before the merger! Mind boggling.

Perliger subsequently describes the use of "two-stage hierarchical regression analysis" which is "intended for controlling both state population size and density". I'm not familiar with what exactly that means, but whatever "controlling" entails, it doesn't appear to have much to do with controlling for variables. The correlations between violent attacks and black and Jewish total populations remained robust (.47 and .69, respectively), but for black and Jewish population proportions, the correlations were much weaker (.16 and .11). The relationship with the size of a state's Hispanic population and proportion apparently disappears entirely. From this, Perliger determines that "anti-Semitic and anti-African American sentiments and narratives are still emphasized and dominant ... hence there is a delay in the identification of the Hispanic minority as a threat by far-right groups."

Doing a little legwork with Perliger's data, the positive correlation between a state's hate rate and its total population is a moderate .33 (p = .02). While it's notable that such a relationship exists at all, it renders the commentary Perliger offers meaningless. Here's a state ranking of the annual rate of "far right attacks" per 100,000 people over the period covered:

StateRate
1. District of Columbia.303
2. Oregon.141
3. Maine.115
4. New York.110
5. Vermont.104
6. Massachusetts.104
7. New Hampshire.096
8. Washington.092
9. California.090
10. Idaho.088
11. Montana.087
12. Connecticut.084
13. Maryland.073
14. New Jersey.068
15. Rhode Island.066
16. Nevada.065
17. Iowa.064
18. Arizona.062
19. Delaware.062
20. Louisiana.062
21. New Mexico.061
22. Wisconsin.060
23. Illinois.058
24. Colorado.058
25. Florida.056
26. Pennsylvania.054
27. Minnesota.051
28. North Dakota.051
29. Indiana.051
30. West Virginia.049
31. Missouri.048
32. Alaska.048
33. South Dakota.047
34. Wyoming.046
35. Nebraska.045
36. Kentucky.041
37. Tennessee.040
38. South Carolina.040
39. Arkansas.038
40. North Carolina.038
41. Virginia.038
42. Kansas.035
43. Oklahoma.034
44. Texas.031
45. Michigan.031
46. Mississippi.029
47. Alabama.029
48. Georgia.028
49. Ohio.027
50. Hawaii.009
51. Utah.005

For comparative purposes, the national violent crime rate per 100,000 people in 2011 was 386.3. DC--home to so many militia types, as is as well-known as it is well established!--has highest far-right hate rate in the country. That alarmingly high rate is 1/1,277th of the national violent crime rate. Mercifully, the national hate rate is only 1/6,895th of the national violent crime rate. Yes, one of America's most pressing problems is indeed its violent, far-right extremists!

This is all really just a distraction, which I suppose is the point, much like designated "hate" crimes in general are (similarly to what is presented in the preceding table, DC has the second highest hate crime rate in the country, while Mississippi has the lowest--the correlation between Perliger's far-right hate rate and hate crime rates at the state level is a statistically significant .43, and with the South Dakota outlier removed, it jumps to .56). But the fact that tripe like this is being commissioned at the highest reaches of the nation's military establishment strikes me as almost indisputable evidence that we are doomed.

Thanks to an email from a reader who prefers to remain anonymous for pointing out James Bowery pointing out Perliger's report. The reader suggests those scandalized by this shoddy work write to the current commandment of cadets to express their displeasure:

Attn: Brig. Gen'l. Richard Clark
W. Pt Mil. Academy
606 Thayer Road
W Pt., NY 10996

Saturday, January 26, 2013

Rates of unsolved murder by state

News reports based on FBI statistics show that somewhere between 35%-40% of homicides in the US go unsolved in the US today. Uniform Crime Reporting data, available at the state level (excluding Florida), show that right at one-third of homicide offenders remain racially unidentifiable. These unidentified killers are the ones who haven't been caught, which is why law enforcement is uncertain of their racial compositions.

This means we have access to rates of unsolved murders at the state level staring us in the face. Parenthetically, there are presumably a small number of homicides for which a perpetrator's race is reported even though he is never positively identified, which would explain why the UCR data on the racially unidentifiable comes in at 33% while the FBI reports an unsolved rate in the 35%-40% range. Still, the following estimates must be pretty damn close to the real thing.

The following table ranks states (with the exclusion of Florida for which no data are available) by their rates of unsolved murders. It's like golf here--the higher a state's percentage, the worse it's doing:

StateUnknown
1. District of Columbia56.1%
2. Illinois55.4%
3. Maryland46.1%
4. New York44.0%
5. California43.9%
6. Massachusetts43.8%
7. Rhode Island42.0%
8. New Jersey41.8%
9. Michigan38.8%
10. Connecticut37.1%
11. Missouri36.7%
12. Indiana36.3%
13. Arizona34.7%
14. Nevada34.6%
15. Ohio31.4%
16. Louisiana31.2%
17. Alabama27.8%
18. Hawaii26.5%
19. Georgia26.3%
20. Kentucky26.1%
21. Texas26.0%
22. North Carolina25.5%
23. Pennsylvania25.1%
24. New Mexico24.5%
25. Arkansas21.7%
26. Kansas21.1%
27. Colorado20.8%
28. Virginia19.8%
29. Oklahoma19.0%
30. Nebraska19.0%
31. Mississippi18.7%
32. Washington17.9%
33. Minnesota17.8%
34. Wisconsin17.5%
35. Alaska17.4%
36. Delaware16.7%
37. New Hampshire15.8%
38. Oregon15.7%
39. Utah15.6%
40. Tennessee14.6%
41. West Virginia12.1%
42. South Carolina10.6%
43. Maine10.4%
44. Iowa9.8%
45. South Dakota9.2%
46. Montana8.2%
47. Vermont5.6%
48. North Dakota4.5%
49. Wyoming4.5%
50. Idaho3.9%

An accompanying visualization is available here.

I wouldn't fault someone for imagining that rural murders must be the easiest ones to get away with. If I leave my house and head west, it's 600 miles of sparsely populated farmland and prairie from here to Denver. How would anyone find a body buried under the great blue sky out there in the middle of nowhere? Yet rural states dominate the bottom of the list, while DC, by far the most urban 'state' listed, has the inglorious distinction of being the worst of the worst when it comes to positively identifying killers. This article on the subject of unsolved homicides from the Scripps Howard News Service gives an indication as to why. It requires a little reading between the lines, of course:
Despite dramatic improvements in DNA analysis and forensic science, police fail to make an arrest in more than one-third of all homicides. National clearance rates for murder and manslaughter have fallen from about 90 percent in the 1960s to below 65 percent in recent years.

The majority of homicides now go unsolved at dozens of big-city police departments, according to a Scripps Howard News Service study of crime records provided by the FBI.

...

Experts say that homicides are tougher to solve now because crimes of passion, where assailants are easier to identify, have been replaced by drug- and gang-related killings. Many police chiefs -- especially in areas with rising numbers of unsolved crimes -- blame a lack of witness cooperation.
---

++Addition++A sarcastic Steve Sailer comments.

Sunday, January 13, 2013

Black homicide rates by state

++Addition++In response to Anthony's comment regarding the variances in the New Hampshire and Vermont black offender rates being the difference between one black murderer over five years in the former and five black murderers over the same period of time in the latter, I've noted by asterisk states in which there were fewer than five black murderers per year over the years considered.

Parenthetically, the correlation between a state's white and black offender rates is a statistically significant .52 (p = 0). Removing the low-end black offending states actually mitigates the relationship slightly to .48 (p = 0).

---

We've taken a look at white homicide rates by state. Now let's give black rates a gander. Using an online database out of the University of Michigan that utilizes the familiar SDA interface to pull figures from the Uniform Crime Reporting Data Series' homicide reports from 2009, 2007, 2006, 2005, and 2003 is how we'll go about it.

Murder rates among the total population are a lot easier to determine definitively than murder rates by subgroups within a population are. Murder is unlikely to go unreported--a corpse usually provides pretty good evidence of a homicide if it occurred. Take the number of murders by the overall population over a year and, voila, we have the homicide rate. However, the perpetrator(s) is sometimes unknown. Consequently, the sum rates of any number of non-overlapping subgroups is always going to fall short of the rate for the total population, even if the entire population falls into one of the various non-overlapping subgroups being considered.

To address this, for each state I figured the percentage of homicides perpetrated by blacks among those homicides for which the race of the killer was known and then assigned this percentage of the unknown perpetrator number to the black total. This assumes that the racial breakdown of unidentified murderers mirrors that of their identified brethren. Shows like CSI would have us believe that lots of the hard-to-catch killers are white. On the other hand, structural racism suggests that society often turns a blind eye to blacks killing blacks in the ghetto. Who knows? My guess is that this method understates the true black rates but that the effects of said understatements are pretty uniform across states.

Because 2006 is conveniently both the mean and median year employed, the black homicide rate per 100,000 people is calculated by averaging the number of murders in each state over the included five years and comparing it to a state's total black population in 2006. Both numerator and denominator include Hispanics who racially identify as black.

Only non-negligible homicides, which constitute the vast majority of all murders, are included.

Data are available from all states for each of the five years under consideration with the exception of DC (2009 data only) and Florida, which apparently doesn't participate in the UCR. Estimated black murder rates during the aughts per 100,000 blacks, by state:

StateRate
1. District of Columbia38.68
2. Pennsylvania34.16
3. Wisconsin30.93
4. Michigan30.89
5. Indiana30.74
6. Arizona29.90
7. Louisiana29.28
8. Nevada27.71
9. Oklahoma27.06
10. Missouri27.01
11. Tennessee25.20
12. California25.13
13. Kansas24.10
14. Maryland23.73
15. Arkansas22.79
16. Ohio22.34
17. Minnesota21.58
18. Vermont*21.24
19. West Virginia19.70
20. Alabama19.61
21. Illinois18.62
22. New Jersey18.19
23. Texas18.00
24. Colorado17.89
25. South Carolina16.64
26. Virginia16.26
27. Kentucky16.16
28. New Mexico16.00
29. North Carolina15.40
30. Alaska*15.39
31. Utah*15.02
32. New York14.76
33. Washington14.53
34. Iowa14.29
35. Delaware14.00
36. Oregon13.94
37. Georgia13.54
38. Massachusetts13.45
39. Wyoming*12.57
40. Rhode Island*11.77
41. Mississippi11.20
42. Connecticut10.57
43. Hawaii*9.14
44. Montana*8.78
45. South Dakota*8.69
46. North Dakota*8.41
47. Idaho*8.28
48. Maine*4.42
49. Nebraska*3.68
50. New Hampshire*2.23

An accompanying visualization is available here.

States without areas of high black population density generally appear to do the best. Mississippi is an impressive exception to that rule. If asked to take a stab at which American cities have the most dangerous black populations, I bet people answering candidly would heavily include Philadelphia, Milwaukee, and Detroit in their short-lists. Well, there you have it. I hear echoes of the unmentionable here, as well.

Saturday, January 12, 2013

Hail found CDC data on white homicide rates by state from 1960. Comparing those with rates from the 2000s* yields a statistically significant positive correlation of .74. More than half of a state's modern white murder rate is 'explained' by what its white murder rate was a couple of generations ago. Everyday things change but basically they stay the same.

* Excluding DC, for which contemporary data appears to be erroneous, and Florida, for which figures on homicide by race aren't publicly available.

Saturday, January 5, 2013

White murder rates by state

++Addition++Hail looks at white homicide rates 45 years prior and compares them to the contemporary figures in a post that should be read in full. To his discussion of "Hispanic inflation", I'll note that 'whites' in the now heavily Hispanic states of Arizona, New Mexico, Nevada, and California were more murderous in 1960 than they are today, though Texas has become a bit less violent, as Steve explains in the comments of Hail's post.

---

Steve Sailer is curious about white murder rates by state. One of Steve's commenters pointed to an online database out of the University of Michigan that uses the SDA interface. Because of my familiarity with said interface, I'll give it my best.

The Uniform Crime Reporting Data Series provides detailed homicide data by state with accessible reports from 2009, 2007, 2006, 2005, and 2003. Steve wants a decade of data to account for year-to-year randomness in small states. For now, we'll have to settle for half of that.

There are a few technical issues to address before diving in. Most importantly, murder rates among the total population are a lot easier to determine definitively than murder rates by subgroups within a population are. Murder is unlikely to go unreported--a corpse usually provides pretty good evidence of a homicide if it occurred. Take the number of murders by the overall population over a year and, voila, we have the homicide rate. However, the perpetrator(s) is sometimes unknown. Consequently, the sum rates of any number of non-overlapping subgroups is always going to fall short of the rate for the total population, even if the entire population falls into one of the various non-overlapping subgroups being considered.

To address this, for each state I figured the percentage of homicides perpetrated by whites among those homicides for which the race of the killer was known and then assigned this percentage of the unknown perpetrator number to the white total. This assumes that the racial breakdown of unidentified murderers mirrors that of their identified brethren. Shows like CSI would have us believe that lots of the hard-to-catch killers are white. On the other hand, structural racism suggests that society often turns a blind eye to blacks killing blacks in the ghetto. Who knows? My guess is that this method overstates the true white rate but that the effect is overstated pretty uniformly across states.

Another issue is ethnicity, specifically with regards to the question of Hispanic origin. The data are broken down into five categories: White, Black, Asian or Pacific Islander, American Indian or Alaskan Native, and Unknown. Hispanics may be of any race, meaning most of them are included in the white numbers. This becomes obvious in the visualization subsequently linked to, as the states along the Southwest border are conspicuously more murderous than the rest of the country is (excepting, perhaps, Florida, which apparently does not participate in the UCR).

Because 2006 is conveniently both the mean and median year employed, the white homicide rate per 100,000 people is calculated by averaging the number of murders in each state over the included five years and comparing it to a state's total white population (including most Hispanics) in 2006.

Only non-negligent homicides, which constitute the vast majority of all murders, are included.

Finally, data are available from all states for each of the five years under consideration with the exception of DC (2009 data only) and the aforementioned Florida no-show. Estimated white murder rates during the aughts per 100,000 whites by state:

StateRate
1. District of Columbia12.43
2. Nevada6.64
3. New Mexico6.63
4. Arizona6.43
5. California5.81
6. Oklahoma4.45
7. Texas4.38
8. Alaska4.12
9. Hawaii3.64
10. Maryland3.52
11. South Carolina3.52
12. Tennessee3.51
13. Louisiana3.42
14. Missouri3.42
15. West Virginia3.05
16. Arkansas3.00
17. Alabama2.91
18. North Carolina2.90
19. Colorado2.86
20. Georgia2.68
21. Kentucky2.66
22. Kansas2.51
23. Wyoming2.49
24. Virginia2.44
25. Washington2.43
26. Indiana2.41
27. New York2.35
28. New Jersey2.27
29. Mississippi2.21
30. Michigan2.19
31. Pennsylvania2.16
32. Idaho2.10
33. Connecticut2.03
34. Oregon1.98
35. Montana1.84
36. Rhode Island1.84
37. Massachusetts1.74
38. Ohio1.73
39. Delaware1.69
40. Utah1.63
41. Maine1.60
42. Vermont1.58
43. Wisconsin1.34
44. Illinois1.27
45. South Dakota1.21
46. Nebraska1.19
47. North Dakota1.19
48. Iowa1.14
49. Minnesota0.91
50. New Hampshire0.86

Here's a cartographic visualization (requires Java).

Live free and don't die!

In addition to the white Hispanic/non-white Hispanic factor, proximity to the Canadian border appears to be associated with pacifistic tendencies. The upper Midwest does best (Nazis these Nordics and Teutons are not!), followed by the Northeast.

DC's whites are conventionally thought to be a cut above the rest of the country. They're the elites, after all. Even the white kids with parents who don't get them into private schools are as sharp as tacks. As Steve sardonically asks:
Has anybody checked out what Ezra Klein, Chris Matthews, and Cokie Roberts are up to?
As noted previously, data on DC are only available for 2009, a year in which there were 12 identified white killers and another 87 who went unidentified. That's a small sample size to work with. Fewer than one-in-five DC whites are Hispanic, so that offers little in the way of explanation, either. While it is a completely urban 'state' and the jokes about the district of corruption practically write themselves, I suspect something else is up with the data from the capital.

Parenthetically, when compared to the rest of the developed world, the US does notoriously bad on measures of criminality (among other things). Race, of course, is a major reason why this is the case. Taken as nations of their own, the upper Midwest and the Northeast look just fine when measured against Europe.

Variables used: V2, V16(a), V25,

Saturday, December 8, 2012

Early voting key to Obama's reelection?

Jack Cashill, who is always putting forward interesting and controversial (in an accurate sense of the word) ideas, is one of my favorite writers, not least of all because he plugged me into the local political scene. His recent contention that early voting was a key to Obama's reelection victory is hardly an exception to that rule. He writes:
In the week before the election, I was invited to speak at my alma mater, Purdue University. As I drove around West Lafayette, what caught my eye was the absence of Obama signs. I did not see one, not even in the faculty neighborhoods. As Obama's unpopularity grew during the last four years, his team at some point decided to concede Indiana. From their perspective, Indiana lacked one tactical asset that Ohio had -- early voting. 
Early voting is a boon for the vote harvesters. The vote harvester's mission is to gather unthinking collectives of potential voters -- nursing home residents, college students, skid-row dwellers, recent immigrants -- and get them to vote. Harvesting does not necessarily mean fraud, but it clearly encourages the same. In James O'Keefe's Project Veritas videos, we saw how easy it was for even a congressman's son -- in this case, Pat Moran, son of Jim -- to cross the line from harvesting to cheating.
After reading this, I decided to try and quantify the alleged phenomenon, but immediately became skeptical (and bemused) upon finding out that Indiana did have early in-person voting. Ohio had five weeks of it to Indiana's four. Seems like a pretty marginal difference. Not potent enough to explain why Obama's share of the vote dropped over 6 points in Indiana yet less than one point in Ohio, anyway.

Still, I ran correlations at the state level on the change in Obama's share of the vote from 2008 to 2012 and the number of days before the general election that in-person early voting began. Team Obama didn't enjoy stronger performance in 2012 relative to 2008 in early voting states. To the contrary, the president performed relatively more poorly the earlier voting began, though the relationship is statistically insignificant (r = .16, p = .25).


Parenthetically, why no link to the phrase "change in Obama's share of the vote from 2008 to 2012"? So far as I can tell, it doesn't exist. Until now, that is! The following table shows the improvement (decline) in Obama's share of each state's popular vote in 2012 from 2008:

StateImp/(Dec)
1. Alaska2.92
2. New Jersey1.07
3. Mississippi0.79
4. Louisiana0.65
5. Maryland0.05
6. Rhode Island(0.16)
7. Alabama(0.38)
8. New York(0.48)
9. Arizona(0.67)
10. California(0.77)
11. South Carolina(0.81)
12. Ohio(0.83)
13. Vermont(0.89)
14. Florida(1.02)
15. Oklahoma(1.12)
16. Massachusetts(1.15)
17. Hawaii(1.30)
18. North Carolina(1.35)
19. Minnesota(1.41)
20. Maine(1.44)
21. Virginia(1.47)
22. Washington(1.49)
23. Georgia(1.51)
24. District of Columbia(1.55)
25. Iowa(1.94)
26. Arkansas(1.98)
27. New Hampshire(2.15)
28. Colorado (2.17)
29. Texas(2.30)
30. Oregon(2.51)
31. Pennsylvania(2.52)
32. Connecticut(2.53)
33. Tennessee(2.76)
34. Nevada(2.79)
35. Michigan(3.22)
36. Delaware(3.33)
37. Kentucky (3.37)
38. Wisconsin(3.44)
39. Idaho(3.47)
40. Nebraska(3.51)
41. Kansas(3.66)
42. New Mexico(3.92)
43. Illinois(4.32)
44. Wyoming(4.72)
45. South Dakota(4.88)
46. Missouri(4.91)
47. Montana (5.55)
48. North Dakota(5.92)
49. Indiana(6.02)
50. West Virginia(7.04)
51. Utah(9.66)

Fittingly (and tangentially), Utah was the reddest state and Hawaii the bluest--excluding DC, that is, which, when one really thinks about it, is even more fittingly the Democrats' best than Hawaii is.

While Jack may not be on empirically solid footing in this instance, the GOP should still heed his general counsel of "tightening the electoral process", as returns out of Pennsylvania highlighted:
It's one thing for a Democratic presidential candidate to dominate a Democratic city like Philadelphia, but check out this head-spinning figure: In 59 voting divisions in the city, Mitt Romney received not one vote. Zero. Zilch.

...

Was there not one contrarian voter in those 59 divisions, where unofficial vote tallies have President Obama outscoring Romney by a combined 19,605 to 0?

The unanimous support for Obama in these Philadelphia neighborhoods - clustered in almost exclusively black sections of West and North Philadelphia - fertilizes fears of fraud, despite little hard evidence.

Saturday, November 24, 2012

Time to abort opposition to abortion?

Reflecting on the 2012 presidential election, Half Sigma writes:
Republicans are on the losing side of the abortion issue. It doesn’t matter that Romney, personally, didn’t make abortion a big issue. Everyone knows that Republicans are against abortion, and he selected a staunchly anti-abortion Vice Presidential nominee in Paul Ryan. That the Republican Party has morons like Richard Mourdock who think that the demon-spawn of rapists are a “gift from God” only makes things that much worse.
The Edison exit polls, paid for and reported on by the major media, didn't query voters on abortion at the state level, but Reuters has the information. The following shows the public split on the legality of abortion in the nine tightest swing states as well as in Michigan, Minnesota, and Pennsylvania--mostly white, moderate places that it is imperative for the GOP to convert to red to maintain electoral viability in the face of demographic trends (read Hispanic immigration and fecundity) coloring states like Colorado, Arizona, Florida, Nevada (which has probably already crossed the rubicon)--and eventually even strongholds like Texas--blue. The "legal" column is comprised of those saying abortion should be legal in "most" or "all" cases; the "illegal" column of those responding it should be illegal in "most" or "all" instances. The "unsure" contingents are ignored:

StateLegal %Illegal %
Nevada69.330.7
New Hampshire67.632.4
Colorado62.337.7
Florida62.337.7
Pennsylvania60.939.1
Virginia60.339.7
Ohio56.943.1
Minnesota56.743.3
Michigan56.143.9
Wisconsin55.144.9
Iowa53.746.3
North Carolina53.446.6

In all twelve of the states under consideration, the pro-choice position is held by a majority of the electorate. And in places like Virginia and Colorado--just a decade ago seemingly reliably Republican--there exists pro-choice 'super majorities'. If the GOP isn't able to enlist the states with old America demography--Ohio, Iowa, Wisconsin, Minnesota, Michigan, and Pennsylvania--in a hurry, it's conceivable to me that I'll never see another Republican president in my lifetime. The above strikes me as reasonable evidence that the part of the official 2012 Republican National Committee platform that reads as follows makes this crucial task even more difficult to accomplish:
We support a human life amendment to the Constitution and endorse legislation to make clear that the Fourteenth Amendment’s protections apply to unborn children. We oppose using public revenues to promote or perform abortion or fund organizations which perform or advocate it and will not fund or subsidize health care which includes abortion coverage. We support the appointment of judges who respect traditional family values and the sanctity of innocent human life.
HS thinks dropping the pro-life platform (along with a determination to hold the line on tax rates for high earners) from the national ticket is the way to get there. The I'm-no-political-strategist disclaimer assumed, the GOP should take a 10th amendment states' rights tact on abortion. It'll retain the pro-lifers (because hey, at least the federal government won't be against us*) without turning off SWPL whites, who don't do much aborting of their own but who like to think they'd be able to if the need ever arose. Taking a page from Gary Johnson's playbook, it could even be pitched as being the ultimate 'pro-choice', position. Onward, liberty!

* In states like Mississippi (37.8% legal, 62.2% illegal), abortion could be outlawed entirely, although there'd undoubtedly be some rhetorical adroitness required to deal with the charge that to get to a states' rights spot on abortion, Roe v Wade would have to be revisited.

Saturday, October 6, 2012

2008 Presidential electoral map, $100k+ only

One of my more instructive (and favorite, personally) posts shows hypothetical electoral maps from the 2008 presidential election when varying selected demographic restrictions are introduced. I'll do the same this November and as a refresher for doing so, here is a look at how things would've shaken out if only those from households earning at least six figures had been eligible to vote:


In this scenario, McCain wins 298-240. In reality, of course, Obama crushed McCain, 365-173.

Half Sigma has on several occasions spoken of how the wealthy are increasingly turning away from the GOP and towards the Democratic party, repelled by the former's increasing Palinism. That sounds a bit dated nearly four years later, with the ascension of the tea party movement, the transformation of the Obama image from a SWPL into a racialist redistributor, the relegation of the former Alaska governor to bit segments on Fox News, and the elevation of a sharp, sober, successful, socially moderate guy to the top of the Republican ticket, but I'd argue that he oversold it at the time as well, as the map above illustrates.
ban nha mat pho ha noi bán nhà mặt phố hà nội