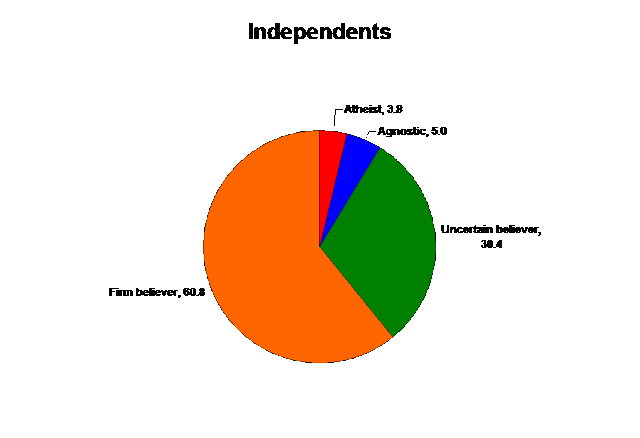
Like children often do, I have many questions. To the GSS I say, "Tell me all your thoughts on God". The following graphs show the percentage distributions for four categories of theistic belief across a host of usual-suspect variables. For contemporary relevance, all results are from 2000 onward. By race:
By sex:
By political orientation:
By partisan affiliation:
By community type at the age of 16:
By social class:
By age range:

By intelligence*:
By educational attainment:
The quintessential atheist is a high IQ, upper class, urban, white (or Asian), young, liberal Democratic guy with a doctorate. Firm belief is pretty much the norm across the board and a plurality just about anyway one broadly slices it, but the further one moves away from the quintessential atheist, the more theistic things become.
GSS variables used: GOD(1)(2)(3-5)(6), RACECEN1(1)(2)(4-10)(15-16), SEX(1)(2), POLVIEWS(1-3)(4)(5-7), PARTYID(0-2)(3)(4-6), RES16(1-2)(3-4)(5-6), CLASS, AGE(18-29)(30-44)(45-64)(65-89), -WORDSUM(0-3)(4-5)(6)(7-8)(9-10), EDUC(0-11)(12)(13-15)(16-17)(18-20), YEAR(2000-2010)
* For intelligence, respondents are broken up into five categories that come to roughly resemble a normal distribution; Really Smarts (wordsum score of 9-10, comprising 13% of the population), Pretty Smarts (7-8, 26%), Normals (6, 22%), Pretty Dumbs (4-5, 27%), and Real Dumbs (0-3, 12%).
By sex:
By political orientation:
By partisan affiliation:
By community type at the age of 16:
By social class:
By age range:

By intelligence*:
By educational attainment:
The quintessential atheist is a high IQ, upper class, urban, white (or Asian), young, liberal Democratic guy with a doctorate. Firm belief is pretty much the norm across the board and a plurality just about anyway one broadly slices it, but the further one moves away from the quintessential atheist, the more theistic things become.
GSS variables used: GOD(1)(2)(3-5)(6), RACECEN1(1)(2)(4-10)(15-16), SEX(1)(2), POLVIEWS(1-3)(4)(5-7), PARTYID(0-2)(3)(4-6), RES16(1-2)(3-4)(5-6), CLASS, AGE(18-29)(30-44)(45-64)(65-89), -WORDSUM(0-3)(4-5)(6)(7-8)(9-10), EDUC(0-11)(12)(13-15)(16-17)(18-20), YEAR(2000-2010)
* For intelligence, respondents are broken up into five categories that come to roughly resemble a normal distribution; Really Smarts (wordsum score of 9-10, comprising 13% of the population), Pretty Smarts (7-8, 26%), Normals (6, 22%), Pretty Dumbs (4-5, 27%), and Real Dumbs (0-3, 12%).


0 comments:
Post a Comment