RSS
Facebook
Twitter

Saturday, June 30, 2012

Which way to Happy Happy Village?

Oh, so you say all you want is to just be happy? By way of ordinary least squares, here are the multiple regression coefficients for nine variables that are, in the conventional wisdom, arguably putative predictors of happiness, with the obligatory qualifier that some component of sunniness, of yet undefined magnitude, is innate. For contemporary relevance and to avoid racial confounding, responses are from 2000 onward and only non-Hispanic whites are included. Asterisks indicate statistical significance at 95% confidence.

First, for men:

Age -- .27* (youth = happiness)
Marital status -- .24* (marriage = happiness)
Class -- .24* (higher status = happiness)
Church attendance -- .11* (worship = happiness)
Education -- .06 (more education = happiness)
Political orientation -- .04 (conservatism = happiness)
Children -- .04 (procreation = happiness)
Number of female partners -- .00 (no relationship at all)
IQ (wordsum) -- .00 (no relationship at all)

The parenthetical stuff is there to clarify which direction the correlation runs in and shouldn't be interpreted as anything close to an absolute statement on causation.

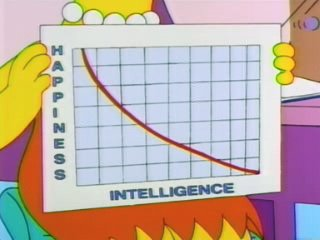
Being young, married, blue-blooded, and active in church are predictors of higher levels of self-reported happiness (I bet Mitt Romney is and has always been a really happy guy). Lisa didn't quite get it right with her graph showing a vigorous inverse correlation between happiness and intelligence, but what one focuses his cognitive horsepower on probably matters more than the number of stallions he has in the reigns.

This more-or-less meshes with the Game perspective--youthfulness and high socio-economic status are definite pluses, and marriage, while scorned as an emasculating deathtrap, does indicate some level of attraction to other women, which can potentially be used to a philander's advantage. While notches in the belt don't obviously bring happiness, they don't push it away, either.

And for women:

Marital status -- .26* (marriage = happiness)
Class -- .24* (higher status = happiness)
Education -- .23* (more education = happiness)
Age -- .18* (youth = happiness)
Church attendance -- .09* (worship = happiness)
Children -- .05 (procreation = happiness)
Political orientation -- (.03) (liberalism = happiness)
Number of male partners -- .03 (fewer partners = happiness)
IQ (wordsum) -- .00 (no relationship at all)

Not much in the way of substantive differences between the sexes, except that educational attainment is a relatively stronger predictor of happiness among women than it is among men (perhaps because social status is tied relatively more strongly to educational attainment among women while tied relatively more strongly to wealth among men), and youth is a stronger predictor of happiness among men than it is among women (or, more precisely, old age is a better predictor of unhappiness among men than it is among women).

GSS variables used: YEAR(2000-2010), SEX, RACECEN1(1), HAPPY(1)(3), WORDSUM, EDUC, MARITAL, CLASS, AGE, ATTEND, NUMMEN, NUMWOMEN, POLVIEWS, CHILDS

Wednesday, June 27, 2012

Steady studs, dysgenic dolls

Examining eugenic and dysgenic trends is a bit of a hobby horse here. Levels of educational attainment, religiosity, alpha vs. beta, and monogamy vs. getting around are a few of the angles we've explored. Jayman recently took a thorough look at fertility trends among blacks, simpliciter style, without adding in a bunch of variables, prompting me to want to do the same with whites and Hispanics. Unfortunately, the sample sizes are too small for the former to have much contemporary relevance, so we'll just consider whites.

The following graph shows the mean number of children among non-Hispanic whites aged 40-65 by wordsum grouping*. All data are from 2000 onward:


Jayman found that among black men, the trend is neutral, while a pronounced dysgenic trend exists among black women. The story is similar among whites, although the dysgenic tilt among white women is gentler than it is among black women.

GSS variables used: CHILDS, SEX, YEAR(2000-2010), RACECEN1(1), WORDSUM(0-3)(4-5)(6)(7-8)(9-10)

* Respondents are broken up into five categories that come to roughly resemble a normal distribution; Really Smarts (wordsum score of 9-10, comprising 13% of the population), Pretty Smarts (7-8, 26%), Normals (6, 22%), Pretty Dumbs (4-5, 27%), and Real Dumbs (0-3, 12%)

Saturday, June 23, 2012

Liberalism rankings by country

Expanding on the idea from a previous post showing that America's Religious Right is more permissive than moderate Muslims throughout the Islamic world are, I'll take a stab at sorting countries by attitudes on social issues.

The formula is simple. The WVS asks a series of questions on the justifiability of several different actions and behaviors. Taking the mean responses to the queries on homosexuality, prostitution, abortion, divorce, euthanasia, suicide, and wife beating (inverted)--all on a 10-point scale--and then averaging those, we get a liberalism index score for each country. The higher the score, the more permissive* the inhabitants of the country are. All countries that participated in the fifth wave of the survey, conducted between 2005-2008, for which data on all seven actions and behaviors are available are included with the exception of poor, corrupted Slovenia:

CountryLiberalism
1. Andorra6.9
2. Sweden6.7
3. Switzerland6.2
4. Netherlands6.1
5. Norway6.1
6. France5.9
7. Spain5.7
8. Australia5.7
9. Germany5.5
10. Great Britain5.5
11. Finland5.4
12. Uruguay5.3
13. Canada5.1
14. Japan4.9
15. Bulgaria4.9
16. United States4.8
17. Argentina4.7
18. Serbia4.6
19. Taiwan4.4
20. Mexico4.4
21. Chile4.4
22. Russia4.2
23. Cyprus4.1
24. South Korea4.1
25. Brazil4.0
25. Italy4.0
27. Ukraine4.0
28. Poland3.8
29. India3.8
30. Mali3.6
30. Moldova3.6
32. Zambia3.6
33. Colombia3.5
34. Malaysia3.5
35. South Africa3.5
36. Thailand3.4
37. Romania3.4
38. Trinidad and Tobago3.1
39. Turkey3.0
40. Vietnam3.0
41. Ghana2.9
42. Burkina Faso2.9
42. China2.9
44. Iran2.9
45. Georgia2.8
46. Ethiopia2.8
47. Indonesia2.6
48. Rwanda2.5
49. Jordan2.2

The Occident occupies all the top spots, especially its Northwestern European contingent. The US is a bit more conservative than Northwestern Europe is, but more permissive than some places on the Old Continent are and way more so than most of the rest of the world is. Catholic Italy and Poland are more in line with the more open places in Central Europe and South America. South Asia, sub-Saharan Africa, and the Middle East populate the socially conservative bottom of the list. The East Asian progression, with Japan as the most liberalized, with South Korea following several notches below and China quite a bit farther down than that, meshes well with the idea that as a country becomes more industrialized and developed, it becomes less patriarchal.

Speaking of the patriarchy, let's revisit a subject dealt with by Steve Sailer in his famous article The Return of Patriarchy? and add another data point suggesting that the kinds of conservative Steve prefers aren't the ones who are doing their best to inherit the earth. The correlation between the liberalism index and total fertility rate is an inverse .41 (p = 0)--a moderate relationship, but perhaps a deceptively modest one on account of old Soviet countries getting on board with the free world when it comes to staying out of the birthing ward, but not when it comes to accepting buggery or refraining from hitting one's wife.

WVS variables used: V202, V203, V204, V205, V206, V207, V208

* Dan H. made a good point regarding the slate of actions and behaviors being examined, namely that they are Eurocentric (because societies of European descent are really the only ones with both the interest and wherewithal to carry these sorts of surveys out):
These are softball questions for the Muslim societies. The real questions that show how illiberal many Muslims really are, are not even asked in the World Values Survey.
Questions such as: should someone face death for leaving the faith (Islam or Christianity, respectively)?
Results you get are 76% in Pakistan, 84% in Egypt and 86% in Jordan, three illiberal countries.
...
In America I have lived 33 years and interacted with tens of thousands in my lifetime and never known of anyone who believed in death as punishment for leaving the faith.
By this measure, ~80% of Muslims are less liberal than the most illiberal American. The most illiberal Christian I can think of Terry Jones, the illiberal pastor in Florida, has not gone as far as 80% of Muslims.

Wednesday, June 20, 2012

Asians like Ice People

Half Sigma recently rehashed the familiar reasons why Asians are, as the so-called "model minority", also the inconvenient minority:
Asians also make SWPL whites uncomfortable because of all of the white male/Asian female couples and the lack of mixed-race couples who run in the other direction. This brings up a lot of HBD issues that good white liberals don’t want to think about. Asians also make liberal whites uncomfortable because the existence of a successful minority lends support to the taboo idea that maybe blacks don’t succeed because of their genes and not because they are a minority. The best way to avoid thinking about these things is to avoid Asians.
A Pew survey on Asians in the US adds another reason for why Asians are the left's stickiest minority group, even though they tend to be socially liberal on issues like abortion and mostly vote Democratic (and also act like Belmont SWPLs in their personal lives). The following table shows what we'll deem a harmony index, computed by taking the percentage of Asians who say they get along "very well" with each racial group and subtracting from it the percentage of Asians who say they get along either "not too well" or "not well at all" with that group. The higher the score, the greater the perceived harmony between Asians and the group in question is:

Getting along with...Harmony
Whites+17
Other Asians+13
Hispanics-3
Blacks-13

Asians report getting along with whites even better than they get along with other Asians, far better than they get along with Hispanics and far, far better than they get along with blacks.

Tuesday, June 19, 2012

++Addition++Initially, I forgot to include Italians because I was asleep at the wheel. Looking through all the GSS categories for sample sizes sufficient to include, I apparently just missed them, and though people of Italian descent are on the low end (n = 81), it's still worth including them, for suggestive reasons if nothing else. Thanks to St. Louis for pointing it out.

---

Commenting on an article by Daniel Smith in the NYT about the putative nervousness of Jews, Steve Sailer brings up the collective angst associated with Germans, in contrast to say, Slavs, and discusses what distinguishes inward-looking Teutonic anxiety from entertaining, professionalized contemporary Jewish-branded anxiety. That Smith concedes without objection to the notion that Jews are "the only ethnic group I know of that members of other ethnic groups will unabashedly declare to be suffering from collective neurosis," (never mind the veracity of the claim, which is more about accentuating Jewish victim status than representing reality. You know, reality, that place where non-NAMs are terrified of saying anything negative about Jews and only Jews like Daniel Smith are allowed to write articles discussing Jewish tendencies), shows that it's a stereotype elite Jews are more proud than ashamed of, a point Smith makes explicit later in the piece. Our minds are always racing, juggling all the concerns of the world, that we can't ever just relax in the backyard on the hammock on a lazy summer afternoon. How horrible that we must suffer so!

The archetypal Woody Allen character (not the actual man, as Steve points out) didn't just fashion a stereotype out of thin air, though, it constructed the golem's traits based on real life attributes. Perceptions usually persist because there is at least some element of truth to them. The GSS posed a couple of questions relevant to the topic in 1996, on anxiety, and 1998, on nervousness, to survey participants. The following table shows the average number of days respondents, grouped by religious affiliation, reported feeling "anxious and tense" over the last week and also shows how they assessed their own levels of nervousness over the previous month*:

AnxiousDaysNervousnessScore
Jewish2.59Jewish2.30
Catholic2.40Catholic2.25
No affiliation2.40Other2.26
Protestant2.11Protestant2.18
Other2.04No affiliation2.01

There's justification for Woody Allen's character. One standard deviation is 2.21 days and 1.02 points, respectively, so we're looking at differences of less than one-fourth a SD between Jews and Protestants on both measures, however. Political differences between Jews and Gentiles are a lot more pronounced, for example, than differences in anxiety levels are.

Since we're here, let's do the same, this time by ancestry:

AnxiousDaysNervousnessScore
Italian3.03Native American2.36
Native American2.58Italian2.31
Irish2.48Mexican2.30
German2.27Scottish2.26
French2.14Irish2.22
Scottish2.11French2.13
English/Welsh2.06German2.12
Mexican2.01English/Welsh2.09
African1.75African1.93

That Native Americans collectively show nearly the highest levels of angst doesn't surprise me. Taciturn, yes, and in my experience also demure, insecure, and always up for a sedative.

I don't have much intelligent to say regarding the high Italian numbers. Sample sizes aren't large enough for any other Mediterranean groups. Would we expect Greeks and the Turks to be similarly high on the anxiety scale?
Excepting Italians, it's difficult to distinguish much between people of European stock, other than English oppressors tending less towards neuroticism than the oppressed Irish do.

While blacks often play the leading role when SWPLs talk about things like diversity and minorities, Jews, with whom they often compete for most oppressed status, are capable of willfully forgetting them. After all, other than conceived distinctness from the white majority, Jews and blacks don't have much in common. Case in point, Smith, in attempting to universalize Jewish tendencies as the tendencies expressed by minorities of all stripes, writes:
As Jewish-Americans, the participants were highly susceptible to the kind of ironic, self-deprecatory ethnic pride that many American minorities — not just Jews — like to indulge in. ... Ask a Korean-American or a Greek-American or an Italian-American or an Arab-American who the nuttiest, most nervous, most irreparably self-conflicted people in the world are, and he will invariably point to the members of his own tribe.
Blacks are notably absent. As the preceding table shows, they aren't anxious or nervous, and they aren't self-deprecating, either. When blacks do poke fun of themselves, other blacks are the intended recipients, as even the audience of a Chris Rock (who's about as racially self-deprecating as blacks get) stand up routine illustrates.

GSS variables used: ETHNIC, RELIG, ANXIOUS, NERVOUS

* Scores, on a 5-point scale, are inverted for ease of viewing. The higher the mean value, the more collectively nervous the group is.

Saturday, June 16, 2012

Spoke not a word, though it meant my life

On the question of justice, the contemporary Western world [or Anglosphere, anyway] is collectively more repulsed by a type I error than it is by an error of the second kind, and our judicial system is organized in a way reflecting that. The bar is set high when it comes to demonstrating a person's guilt, the consequences being that people are more likely to go unpunished for committing a crime than they are to be punished for a crime they didn't commit.

But dissent from that societal more is not equally distributed across all groups. On four occasions, the GSS has asked respondents which miscarriage of justice is worse--convicting the innocent or allowing the guilty to go free. Blacks and liberals tilt more heavily in their preference for allowing some guilty people to walk as a cost of ensuring that the innocent aren't convicted (76.3% and 74.9%, respectively, saying that convicting the innocent is worse than letting the guilty off is) than whites and conservatives (71.6% and 70.7%) do.

As Steve Sailer regularly reminds us and the Trayvon Martin case illustrates, though, the "Who? Whom?" question is of paramount importance. In a Florida poll conducted last month, 79% of blacks but only 21% of whites were confident in George Zimmerman's guilt. On the political front, 49% of Democrats and 13% of Republicans asserted that he is guilty of murder. Better lock Zimmerman up to ensure the guilty won't walk!

Getting back to the philosophical, ideological realm, which people hastily evacuate when "Who? Whom?" becomes relevant, it is by intelligence rather than political orientation, sex, or race where divergence in opinion on the question is most pronounced. The percentages of people, by IQ grouping*, who would prefer to see a guilty man let go than an innocent man locked up rather than the other way around:

IQFree
Real dumbs66.0%
Pretty dumbs68.1%
Normals67.0%
Pretty smarts75.3%
Really smarts88.6%

No, dummy, Barabbas' release wasn't the real tragedy!

GSS variables used: VERDICT, WORDSUM, POLVIEWS(1-3)(4)(5-7), RACE

* Respondents are broken up into five categories in a way that approximates a normal distribution; Really Smarts (wordsum score of 9-10, comprising 13% of the population), Pretty Smarts (7-8, 26%), Normals (6, 22%), Pretty Dumbs (4-5, 27%), and Real Dumbs (0-3, 12%).

Wednesday, June 13, 2012

Where the greenback goes

The Romney/Obama split on individual campaign contributions from current employees of Bain Capital over the last year through the end of the latest FEC reporting period is 77.7%/22.3%. Among those who listed the federal government as their employer, it's 17.0%/83.0%. It's obvious an Obama administration will do everything in its power to keep the beast from feeling any hunger pangs, let alone contemplate starving the leviathan. It's less obvious whether or not a Romney administration will.

Parenthetically, while I'm aware that the Bain name comes from its eponymous founder, Bill Bain, I'm surprised it was adopted in the first place and then not subsequently changed at some point, as the homophone "bane" seems awfully convenient to use as a means of conjuring up images of a despoiled economic wasteland, replete with the buzzards of 'vulture capitalism' circling overhead, looking for (or, more accurately, smelling out) dying dinosaurs to pick clean.

Sunday, June 10, 2012

White guys are the worst

A fun article that appeared on the classy site Jezebel (I'm not a regular reader--Tony Horton brought the piece to my attention) does a pretty good job (for an anecdote, anyway) of illustrating the demographic hipness hierarchy that exists in contemporary America. Ben Mandelker, apparently a pretty typical SWPL guy, who is a few months into the P90X workout program, ranks, countdown style, the supporting cast. Like other lists that ostensibly have nothing to do with ethnic, racial, or sexual characteristics, this one allows us to make observations about demographic characteristics that the person or people creating the list probably didn't have in mind when constructing it, at least not consciously.

I've reproduced his rankings in the proceeding table, but replaced names and editorializing with racial and sexual characteristics, as well as a few relevant parenthetical notes. I've inverted from worst-to-best to best-to-worst for ease of viewing:

From best ...
1. Black woman
2. Black man
3. White man* (!)
4. White man (physically handicapped)
5. White woman (bisexual... actually, "omnisexual")
6. White woman (foreign-born)
7. White woman (old)
8. Black man
9. White man 
10. Hispanic woman
11. Asian man
12. White man
13. White man
14. White woman
15. White woman
16. White man (foreign-born)
17. White man
18. White woman
19. White man
20. White man
21. White man
22. White woman
23. White man
... to worst

We know having black friends is hip, even if those friends were immersed in middle class values growing up and they end up living in mostly white neighborhoods (the three black characters' names are Pam, Adam, and Tony, not L'akisha, D'Brickshaw, and Terrance). The lowest ranking non-white is the Asian guy (the West's softest minority target) and he still comes in among the top half. Sexual deviancy and disability provide whites with some limited means for advancement.

In summation, the only black woman takes the gold. The two black guys average a 5 slot. The sole Hispanic gets a 10 slot and the only Asian an 11 slot (a spot also occupied by foreign-born whites). For white women, the mean is the 12 slot, and for white men it's the 14 slot.

Wait, am I describing a specific data set or the modern zeitgeist? Right, I could be doing either thing, hence the illustrative value of Mandelker's article.

* Daniel, who is clearly one cool cat, is my favorite member of the supporting cast, followed closely by Adam (#2) because of how hard he pushes me and Timmy (#20) because he reminds me most of myself.

Thursday, June 7, 2012

Consanguinity and corruption

In the wake of MG's essay on the nature and nurture of corruption, I wondered if a hard correlation between consanguinity rates and graft at the national level had been discovered. Searching for as much, the top returns I received were from MG and HBD Chick. Apparently, it hasn't been an area of academic interest, though HBD Chick is deserving of an academic spot for her intellectual curiosity about and indefatigable efforts researching and relaying consanguinity through history and up to the present to any who happen to be interested in as much.

Why should academics and policy makers take note, though, when they've already identified the culprits? They are, of course, bad laws, bad leaders, and bad institutions! Fix these things and any country is capable of resembling Norway. Any day now we'll get the right laws and enforcement mechanisms in place and use them to throw out the crooks and set things straight in Zimbabwe, Zaire, Syria, Sudan, the Congo, Nigeria, Sierra Leone, Somalia, Burma, Iraq, Afghanistan, Papua New Guinea...

As is often the impetus here, not finding what I was looking for meant needing to figure it out. The data aren't perfect by any stretch, but something is better than nothing. Computing simple, unweighted averages for each country for which studies and surveys have been conducted and subsequently recorded on consang.net and then comparing them to Transparency International's 2011 Corruptions Perception Index yields a correlation of .44 (p = 0). In places where extended families are important and family members are more closely related to one another than they are in the West, outsiders are treated with much less even handedness than kin are and nepotism is, if not the rule, at least perfectly acceptable. In these places, if you're not blood, you're going to have to pay to play.

A correlation of .44 is considered fairly strong in the infinitely varied world of the social sciences, but the true relationship between corruption and consanguinity is almost certainly even more vigorous than that. I'm using imperfect and sporadic data. There is nothing available on inbreeding for about half the countries in the world while for India there are 45 studies for which I must, by necessity, compute a simple average from, because even if I wanted to try and weight the sources for geographic and demographic representativeness within India, I'd be utterly unable to do so competently since I know so little about that extremely complicated country of over 1 billion people.

Further, even to the extent that the data are representative, they leave something to be desired, as the chickadee explains:
what we are talking about here when we discuss inbreeding vs. outbreeding and nepotism and/or corruption are types of altruistic behaviors -- and these behaviors/attitudes have evolved differently in different populations, of course, over time. so you can't just take a population that has been inbreeding for scores of generations, and likely evolved certain altruistic behaviors, and change their behavior patterns via just one or two generations of outbreeding. there is going to be some lag-time.

 why do i say this? because the problem with using the consang.net numbers for the kind of analysis you describe is that there is no time depth to them. if you look at the data @consang.net, it appears as though the chinese have similar inbreeding/outbreeding rates to western europe or canada, but that's only in the last generation or so (and even that is debatable). as i've blogged about, the chinese have been inbreeding for literally millennia. any effects that's had on altruistic behaviors are NOT going to be overturned in one or two generations.
what needs to be done is that the histories of inbreeding/outbreeding in different populations need to be quantified (part of my ongoing, neverending project @hbd chick (~_^) ), and then those numbers need to be compared to transparency international's and/or other figures.
Yet despite this, we still see a rigorous, statistically significant correlation between corruption and consanguinity. Randomly generated numbers don't correlate with one another. If (when?) much of the remaining randomness in the consanguinity numbers is removed and the appropriate adjustments for time depth are made, the observed correlation will prove to be stronger still.

Monday, June 4, 2012

Education, religiosity, and fecundity

++Addition++Heartiste speculates that differences in the joy children bring people correlates inversely with intelligence, especially among men. On the one hand, there's not much in the way of a relationship between intelligence and fecundity among men, with the pronounced dysgenic trend happening primarily on the female side. Yet my own personal experience is similar to Heartiste's--around children they are unrelated to, the more intelligent a person is, the less he tends to be interested in or care about the kids. Parenthetically, the opposite seems to happen when the objects of attention are pets.

---

Dan poses an interesting question
:
Have you looked at they effect of religiosity on fertility when intelligence is held constant? 
This strikes me as a very important question. It is well-established, I think, that religiosity is positively correlated with fertility. But what is the specific impact of religiosity on the fertility of the really smarts, averages and dumb specifically? 
The significance of intelligence in predicting fecundity vanishes when education is controlled for. In the US, high IQ people have fewer children than those of more modest intelligence do, but it's a consequence of the fact that more intelligent people spend more time in school than less intelligent people do. Smart people who don't go to college have nearly the same fertility rates as dull people who don't, and low IQ folks who pursue post-secondary education don't have more children than high IQ people who do so end up having.

What, though, of the relationship between fecundity and religiosity when educational attainment is taken into account? Before delving into the data, it needs to be noted that the measure of religiosity I'm employing is frequency of attendance at a house of worship, which doesn't necessarily shed light on how fervently or literally respondents adhere to the precepts of their religions or the levels of credulity they display towards their faiths.

Marx's famous labeling of religion as the "opiate of the masses" aside, as Charles Murray points out in Coming Apart, the more intelligent and well-educated people are, the more likely they are to go to church (an assertion that the GSS affirms). At first blush, this may appear to present a conundrum: Religious worship and educational attainment are positively correlated, religious worship and fertility rates are also positively correlated, but educational attainment and fertility rates are negatively correlated. For those of some acquaintance with statistics, of course, we'd only necessarily be trying to square a circle here if all three of the aforementioned correlations were perfect, which they are not.

The following graph shows how religiosity and fecundity are related among those with similar levels of educational attainment. For purposes of contemporary relevance, avoiding racial confounding, and allowing time for family formation to occur, data are from 1990 onward, the respondent pool is limited to whites, and those under the age of 35 are excluded:


At each level of education, the trend is one of religiosity and fecundity moving in the same direction, even as fecundity drops among all cohorts as educational attainment increases. The only irreligious people out-procreating the Russ Johnsons and Inductivists of the world are high school dropouts.

From eyeballing the graph, it is difficult to ascertain whether education or religiosity is the stronger predictor of fertility rates. That's because they're about equally predictive. When it comes to predicting fecundity, the OLS standardized regression coefficients (with IQ included for purposes of reiteration) are as follows:

Educational attainment -- (.19)*
Worship attendance -- .15*
Wordsum score -- .00

* Statistically significant

As far as I'm aware, it appears that educational attainment and religiosity are the two strongest predictors of fecundity in the US (and the rest of the Western world?) today.

GSS variables used: CHILDS, EDUC(0-11)(12)(13-15)(16-17)(18-20), YEAR(1990-2010), BORN(1), RACE(1), AGE(35-89), WORDSUM, ATTEND(0)(1-3)(4-6)(7-8)6370726

++Addition++A reader asks:
What happens to the relationship between church attendance and fertility when you hold wordsum constant instead of education?
That would give the clearest picture of all as to whether religious attendance is eugenic...
Here's the graph:


It looks pretty similar to what we get with the education graph in the body of the post, but the association between fecundity and and religiosity is less pronounced, as the regression coefficients mentioned above predict to be the case.

Saturday, June 2, 2012

Our polarized politics

From the perspective of someone who is extremely pessimistic about the prospects of the US' democratic system to successfully guide it past the demographic and economic challenges on the horizon, hearing about how highly polarized politics has become--as if compromising between the Ryan and Obama budget plans like the country would have in the past is all the US needs to do to get its house in order--elicits little more than an eye roll.

But I realize that perspective is an outlier's. Divergence in political orientation really has steadily occurred in the US over the past several decades. Democrats have become more liberal and Republicans more conservative, as the proceeding graph indicates. The y-axis shows the mean political orientation score for each political grouping. The question on political orientation is on a 7-point scale. The higher the score, the more conservative the group is, with 4 as the mid-point indicating perfect moderation:


As someone with a cursory understanding of US history in the second half of the 20th century, my first reaction is that Southern Democrats becoming Reagan Democrats and eventually Republicans might explain the apparent polarization. As conservative Democrats have become disenchanted by the Democratic party's increasing focus on 'civil rights' and a corresponding diminution of bread and butter issues the working class cares most about, they've gone from calling themselves Democrats to calling themselves Republicans without really changing their outlooks and sentiments much.

That may be part of the story, and it's a phenomenon not entirely contained in the South even if more pronounced there than elsewhere, but it's not the whole thing, nor does it even look to be particularly significant. The same graph as above, this time with Southerners* excluded:


There aren't any detectable differences between what we get when Southerners are included or when they're excluded. Political polarization has been occurring nationwide.

GSS variables used: POLVIEWS, PARTYID(0-1)(3)(5-6), REGION(1-4, 8-9), YEAR

* Those living in the West South Central, East South Central, and South Atlantic Census divisions.
ban nha mat pho ha noi bán nhà mặt phố hà nội